

With the introduction of the Abilities API and the AI Client, WordPress has evolved far beyond a traditional content management system into a true execution engine capable of seamlessly bridging user applications with artificial intelligence models of choice. This monumental shift fundamentally changes what the CMS is at its core, enabling deep integration with advanced machine learning capabilities. However, this evolution also introduces a significant layer of complexity to the overall web ecosystem, making process observability and rigorous performance monitoring increasingly vital for anyone managing a modern website.

Site administrators must now account for how machines interact with access logs, as automated bots, internal plugin operations, and external queries become commonplace. To understand the direct impact these emerging AI features have on underlying server resources, administrators need concrete proof derived from robust monitoring tools. By leveraging built-in infrastructure metrics such as Application Performance Monitoring (APM) and server access logs, web managers can accurately gauge how artificial intelligence operations consume backend bandwidth and processing capacity.
How to Monitor AI Workloads in WordPress
Websites currently interact with artificial intelligence in multiple distinct ways, ranging from automated bot and crawler scans to internal operations performed by plugins through the AI Client, and external requests submitted by AI agents querying the site via the Abilities API. Operations such as generating a high-resolution image or transcribing a complex audio file typically take several seconds to complete. During this processing interval, a PHP worker or thread remains tied up and unavailable for other operations, whether those are triggered by a human user or an automated machine.
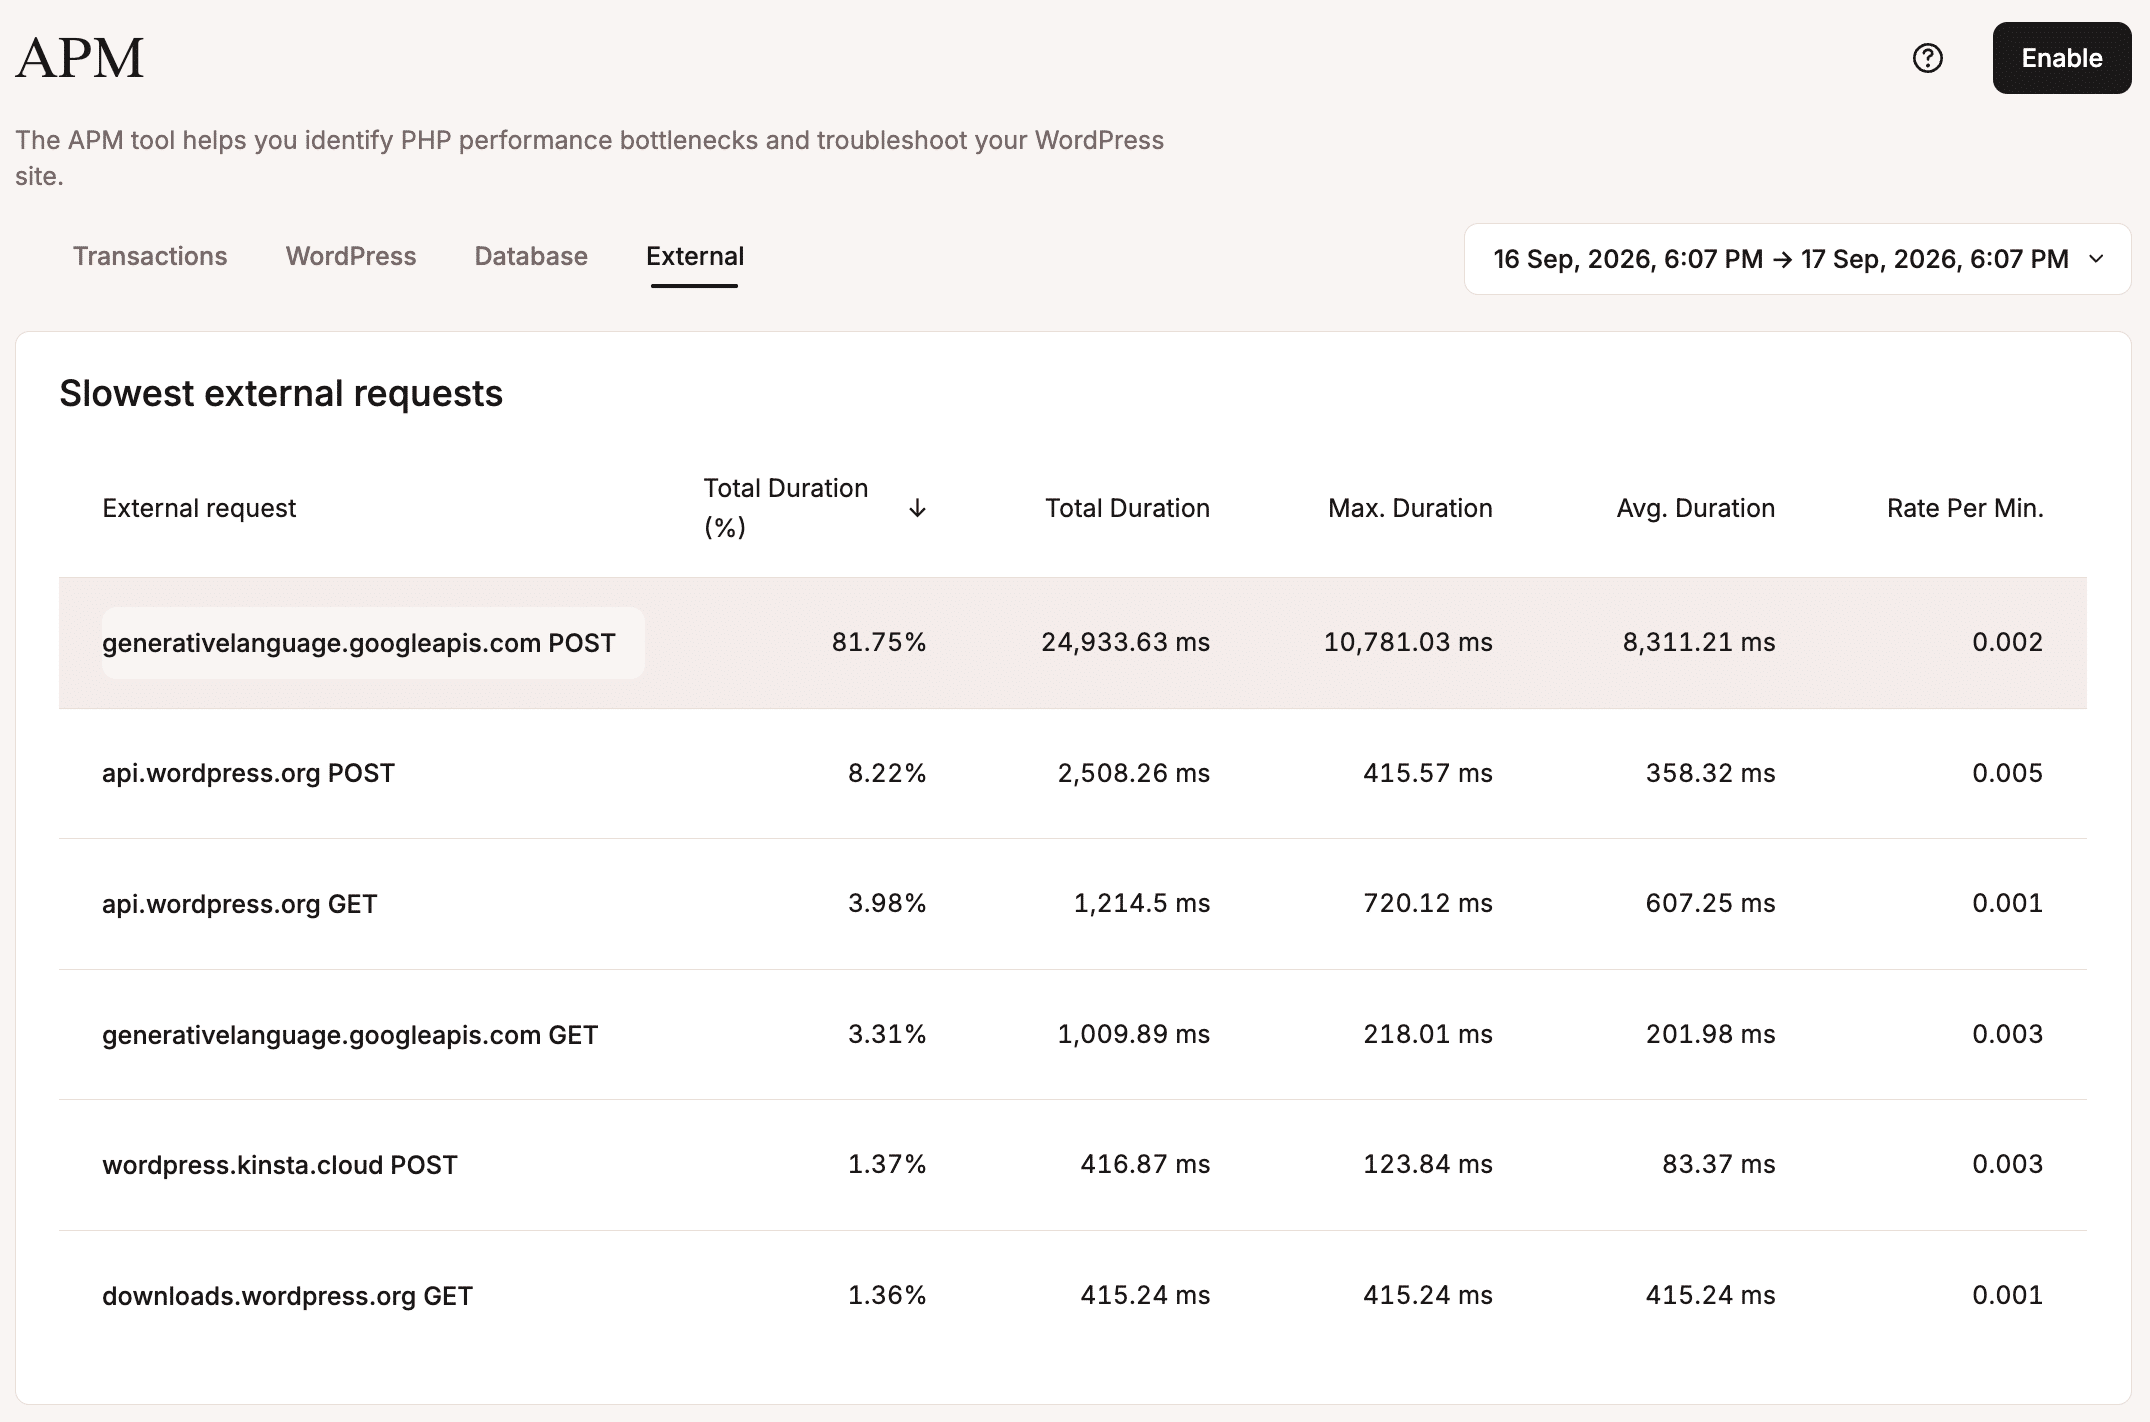
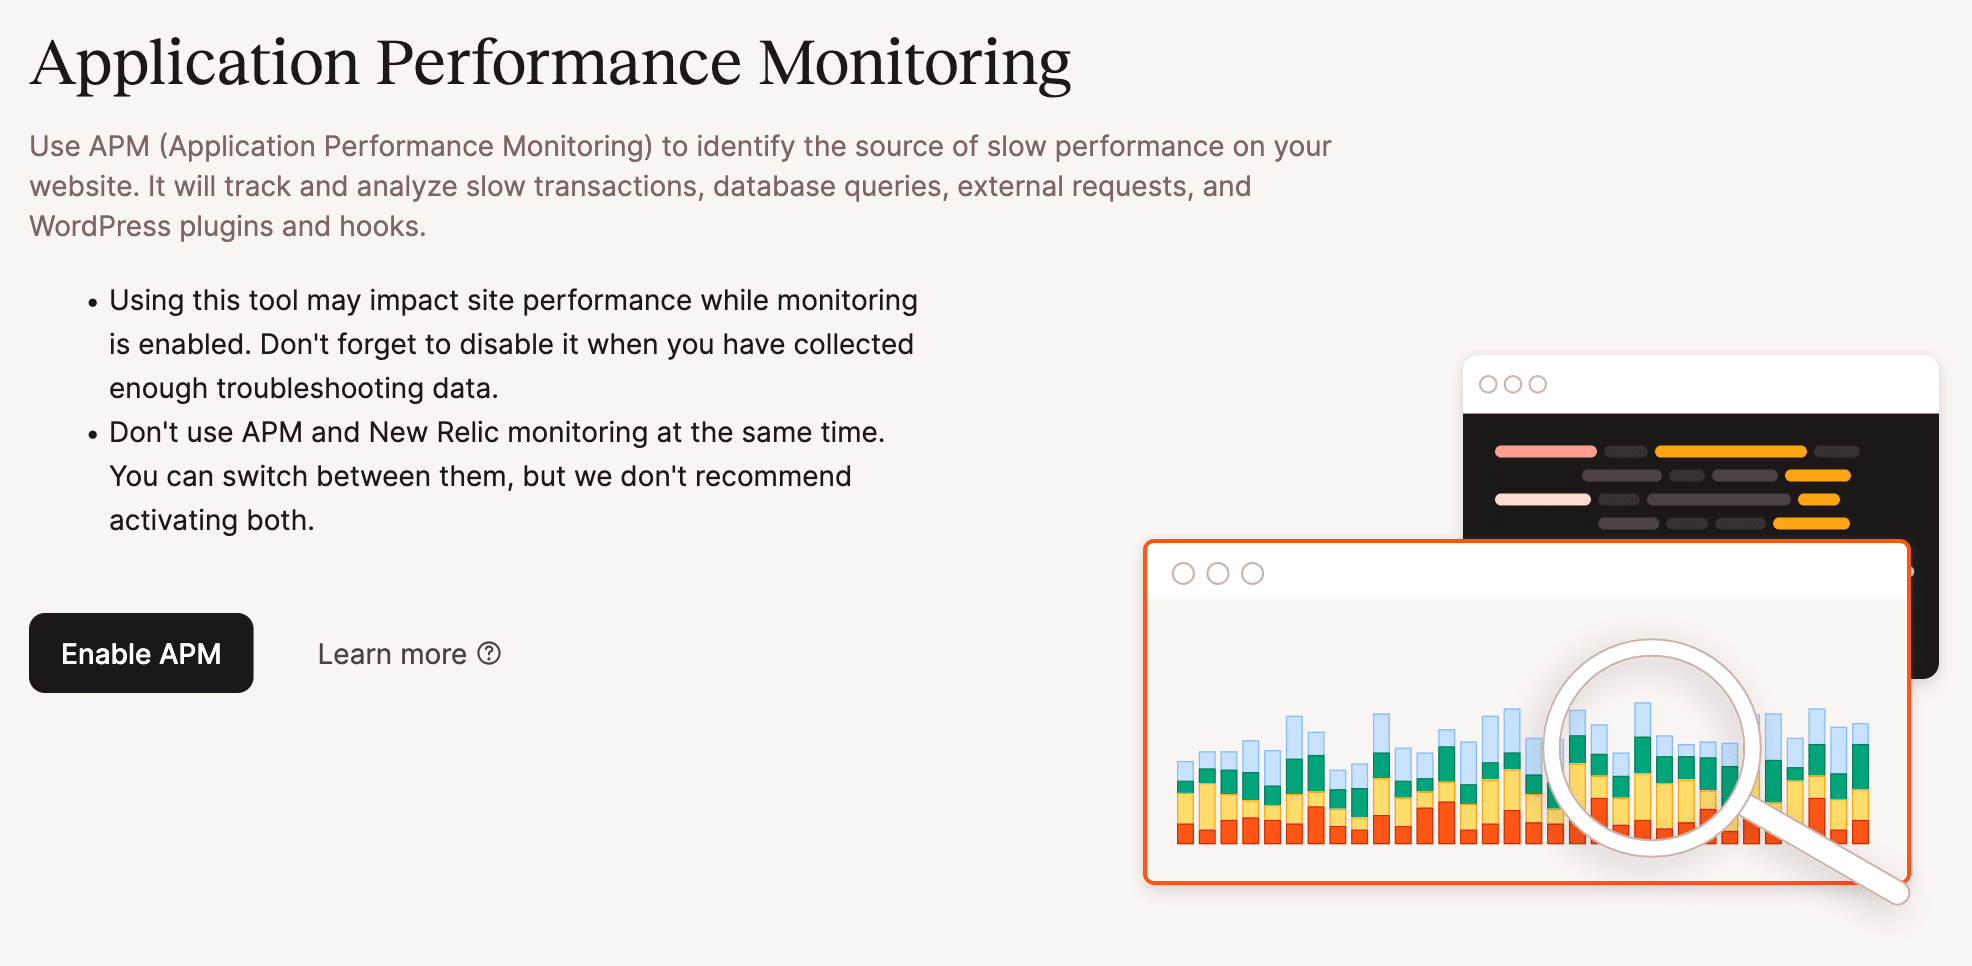
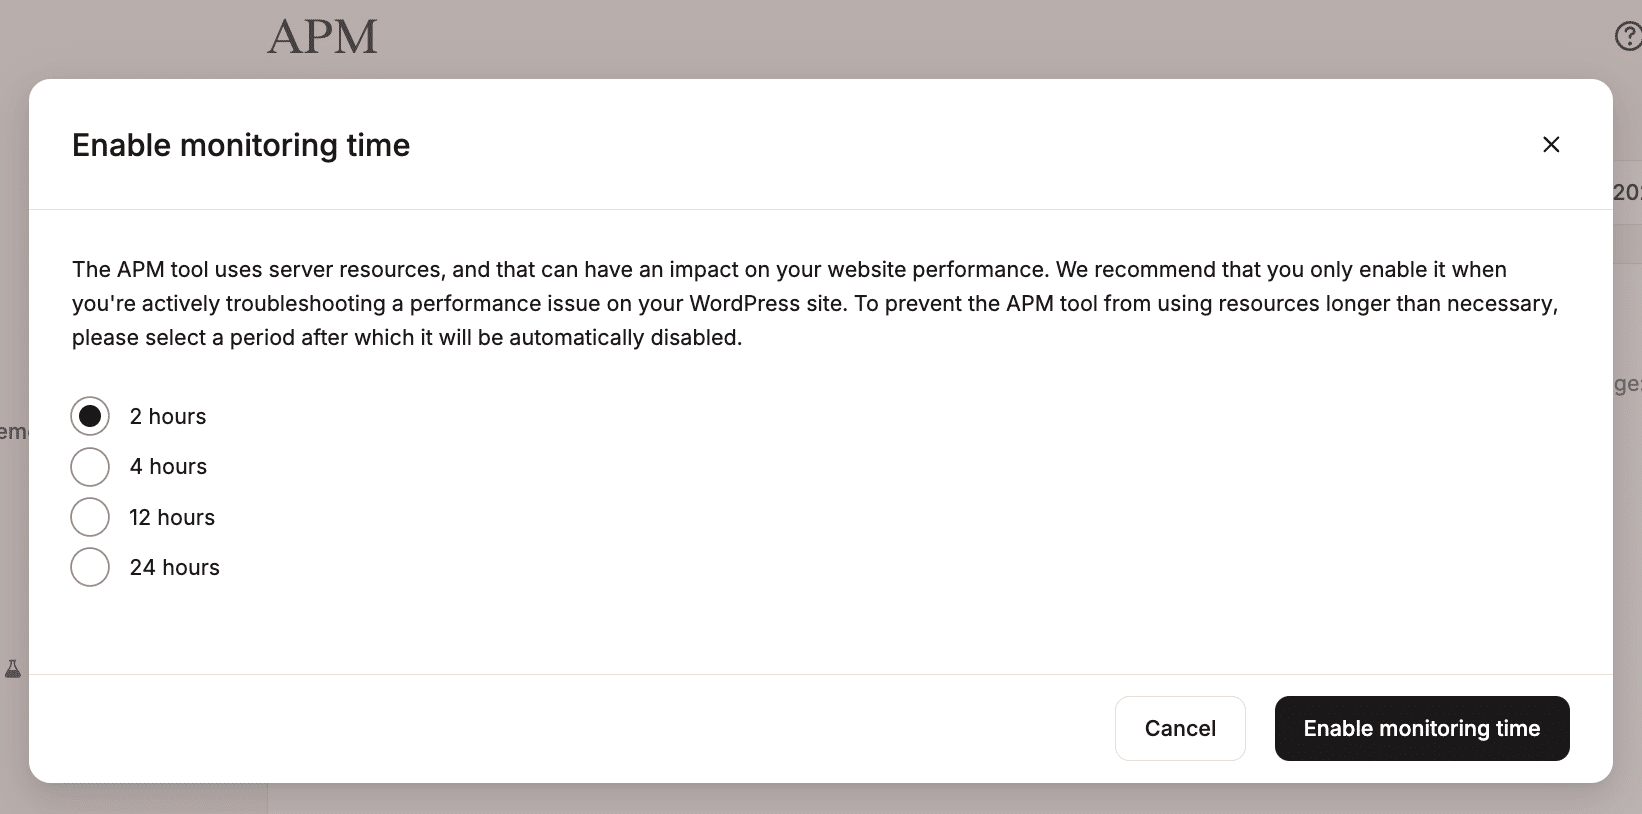
While minor latency might go unnoticed on low-traffic blogs, it becomes a critical performance factor for high-traffic business sites, membership platforms, and e-commerce stores managing thousands of products. Application Performance Monitoring tools help administrators measure this operational footprint precisely. Tools like New Relic track WordPress transactions, hooks, plugins, themes, database queries, and external calls to pinpoint performance anomalies. For hosting platforms that provide native APM utilities directly within their management dashboards, tracking these resource shifts requires little more than enabling the feature and reviewing the automated transaction summaries, slow database queries, and external request logs.
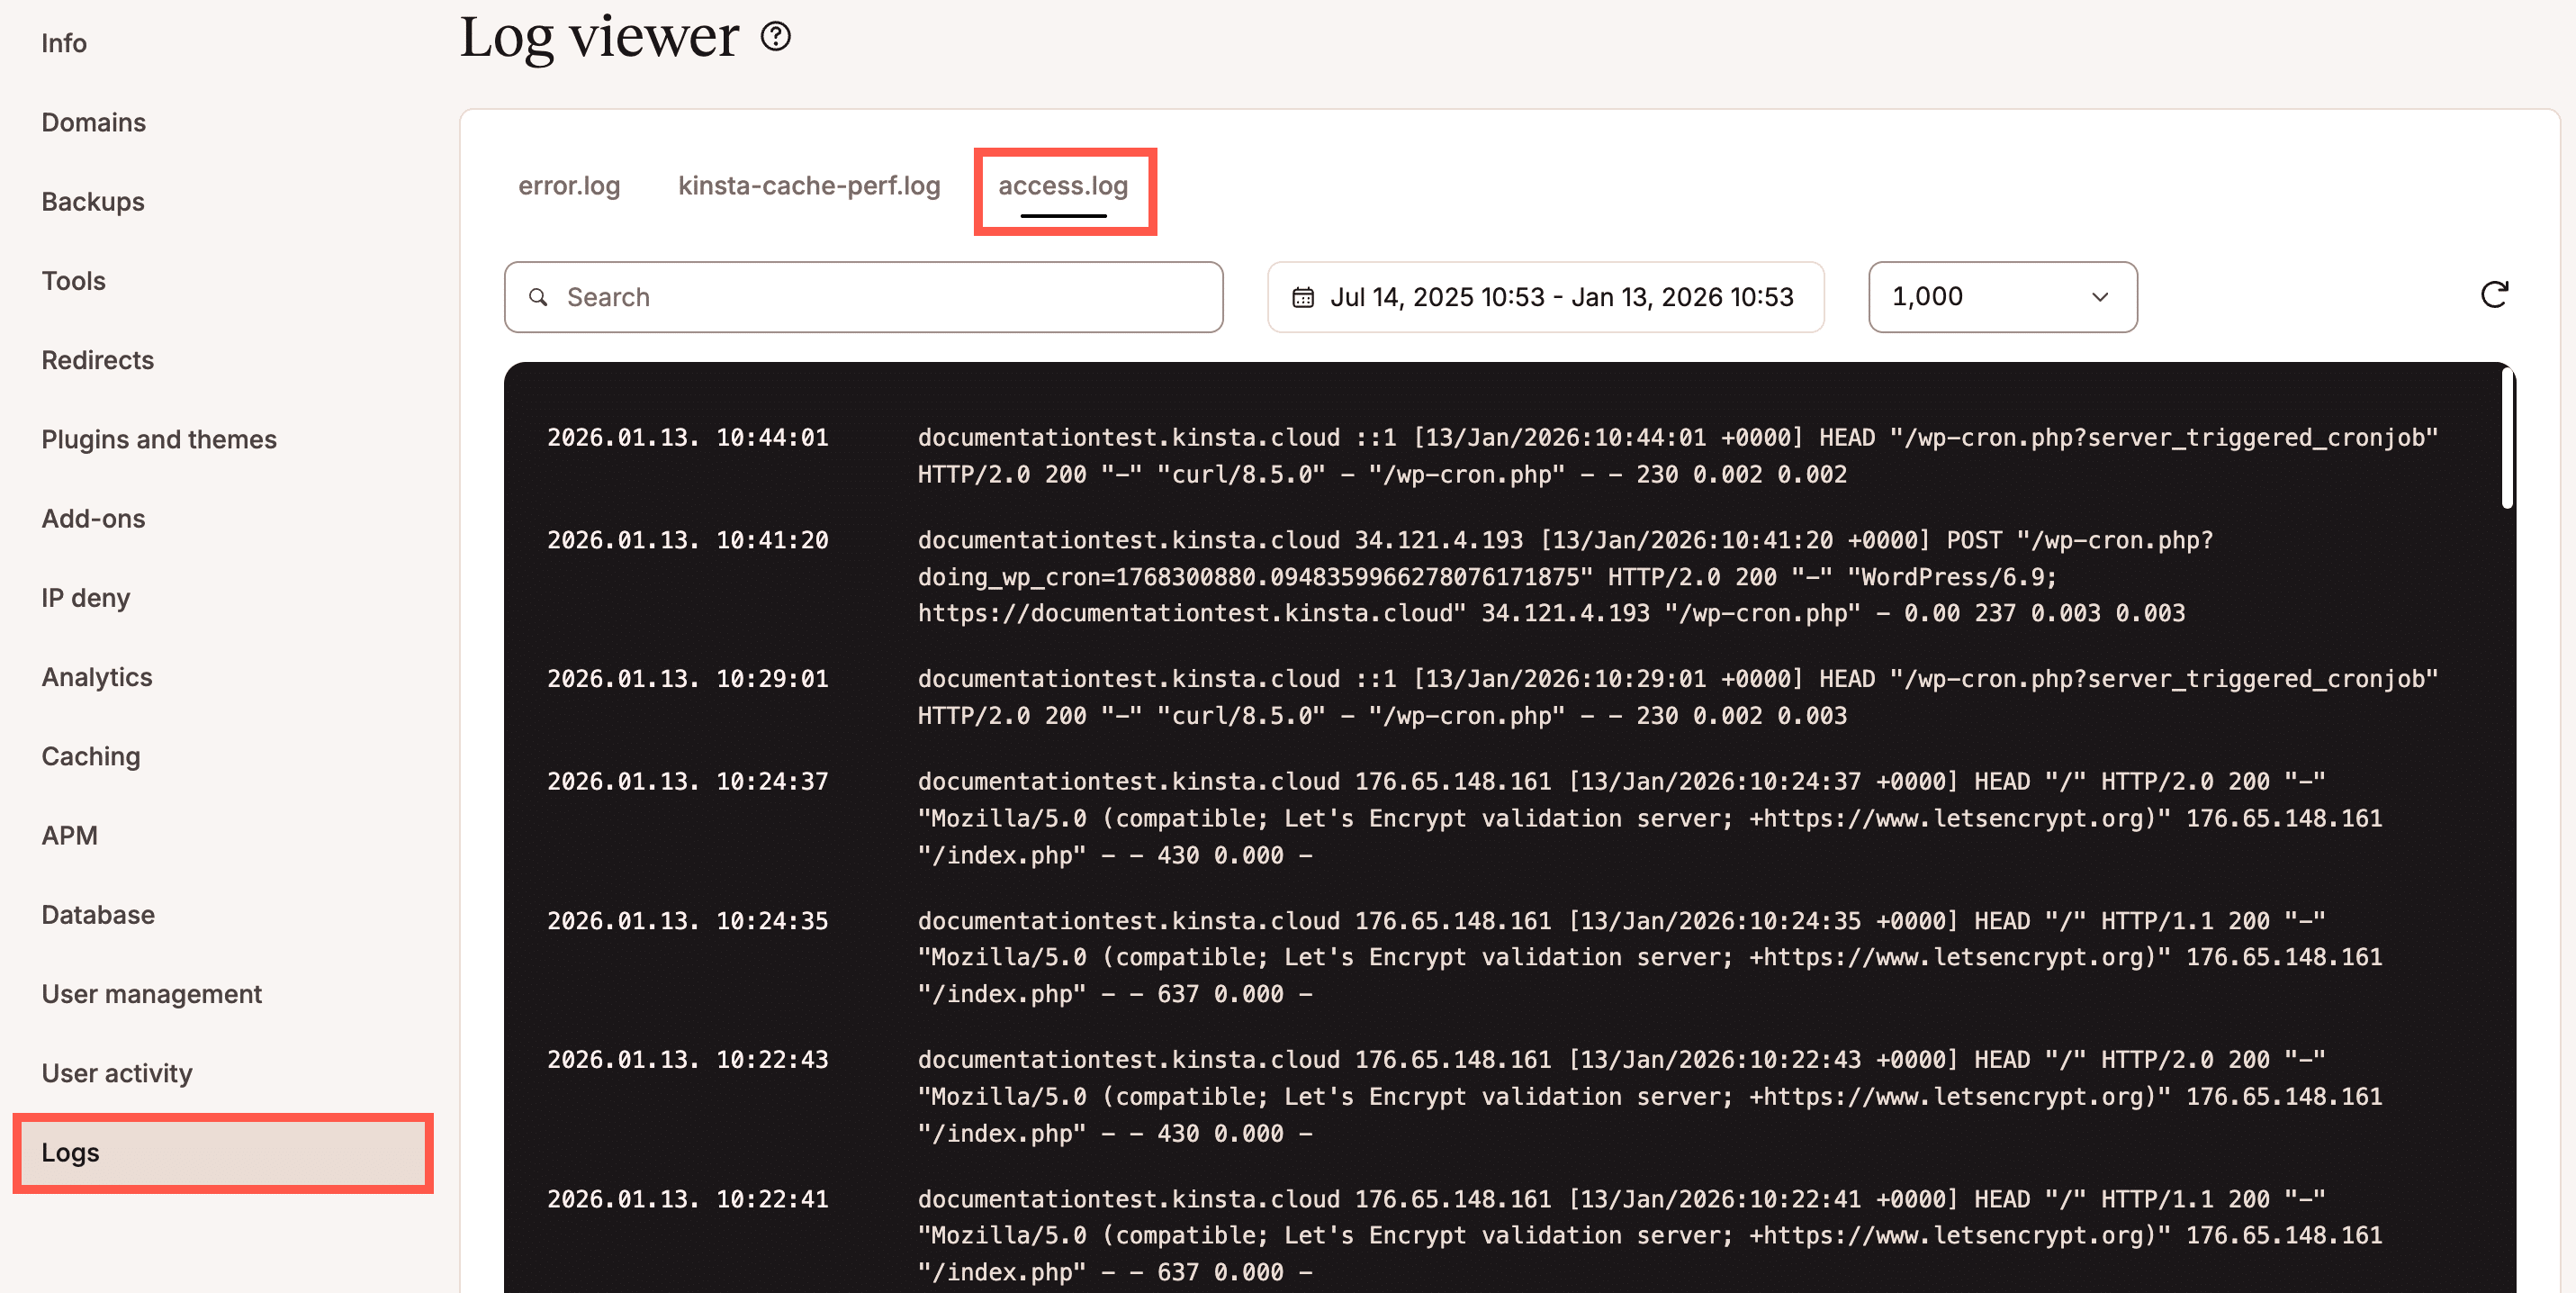
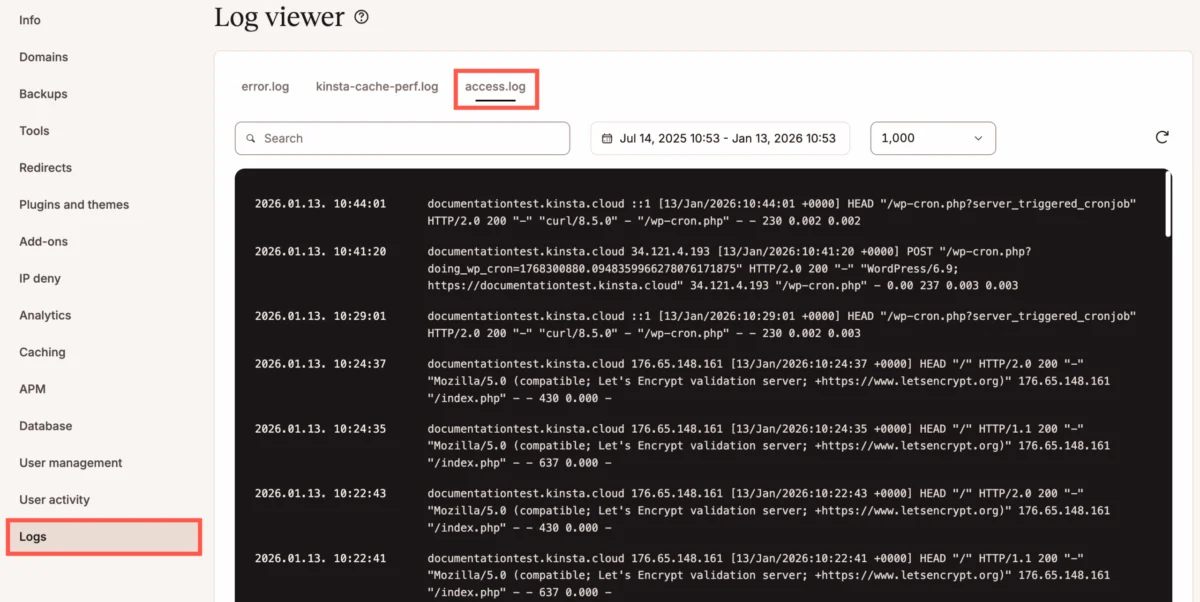
Server access logs and error logs provide another deep source of insight into backend activity. These files record comprehensive data that helps technical teams troubleshoot errors, identify performance bottlenecks, and pinpoint primary traffic sources. Inspecting cache, error, and access logs directly through server file managers or log viewers uncovers the precise mechanics behind resource consumption during complex AI workflows, highlighting why proper infrastructure and monitoring are indispensable for maintaining site stability.
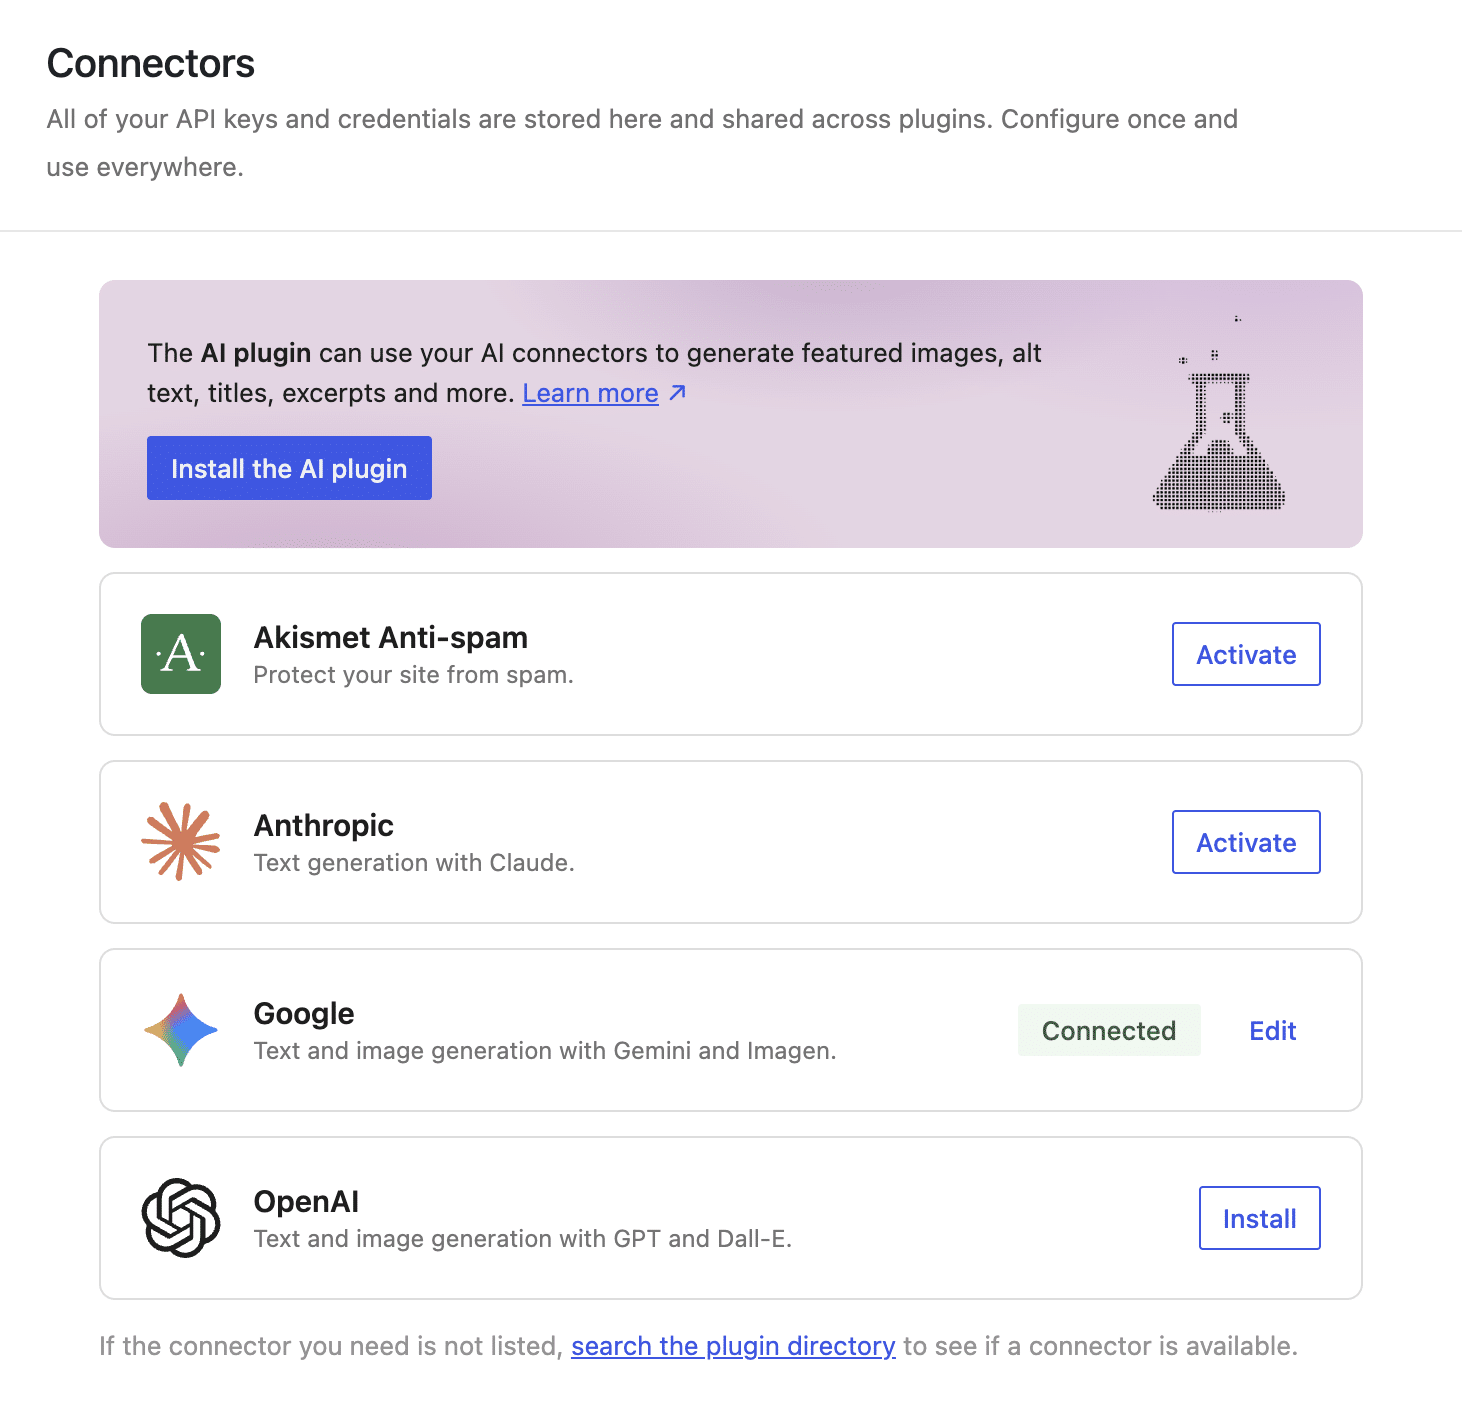
Measuring the Resource Consumption of AI Image Generation
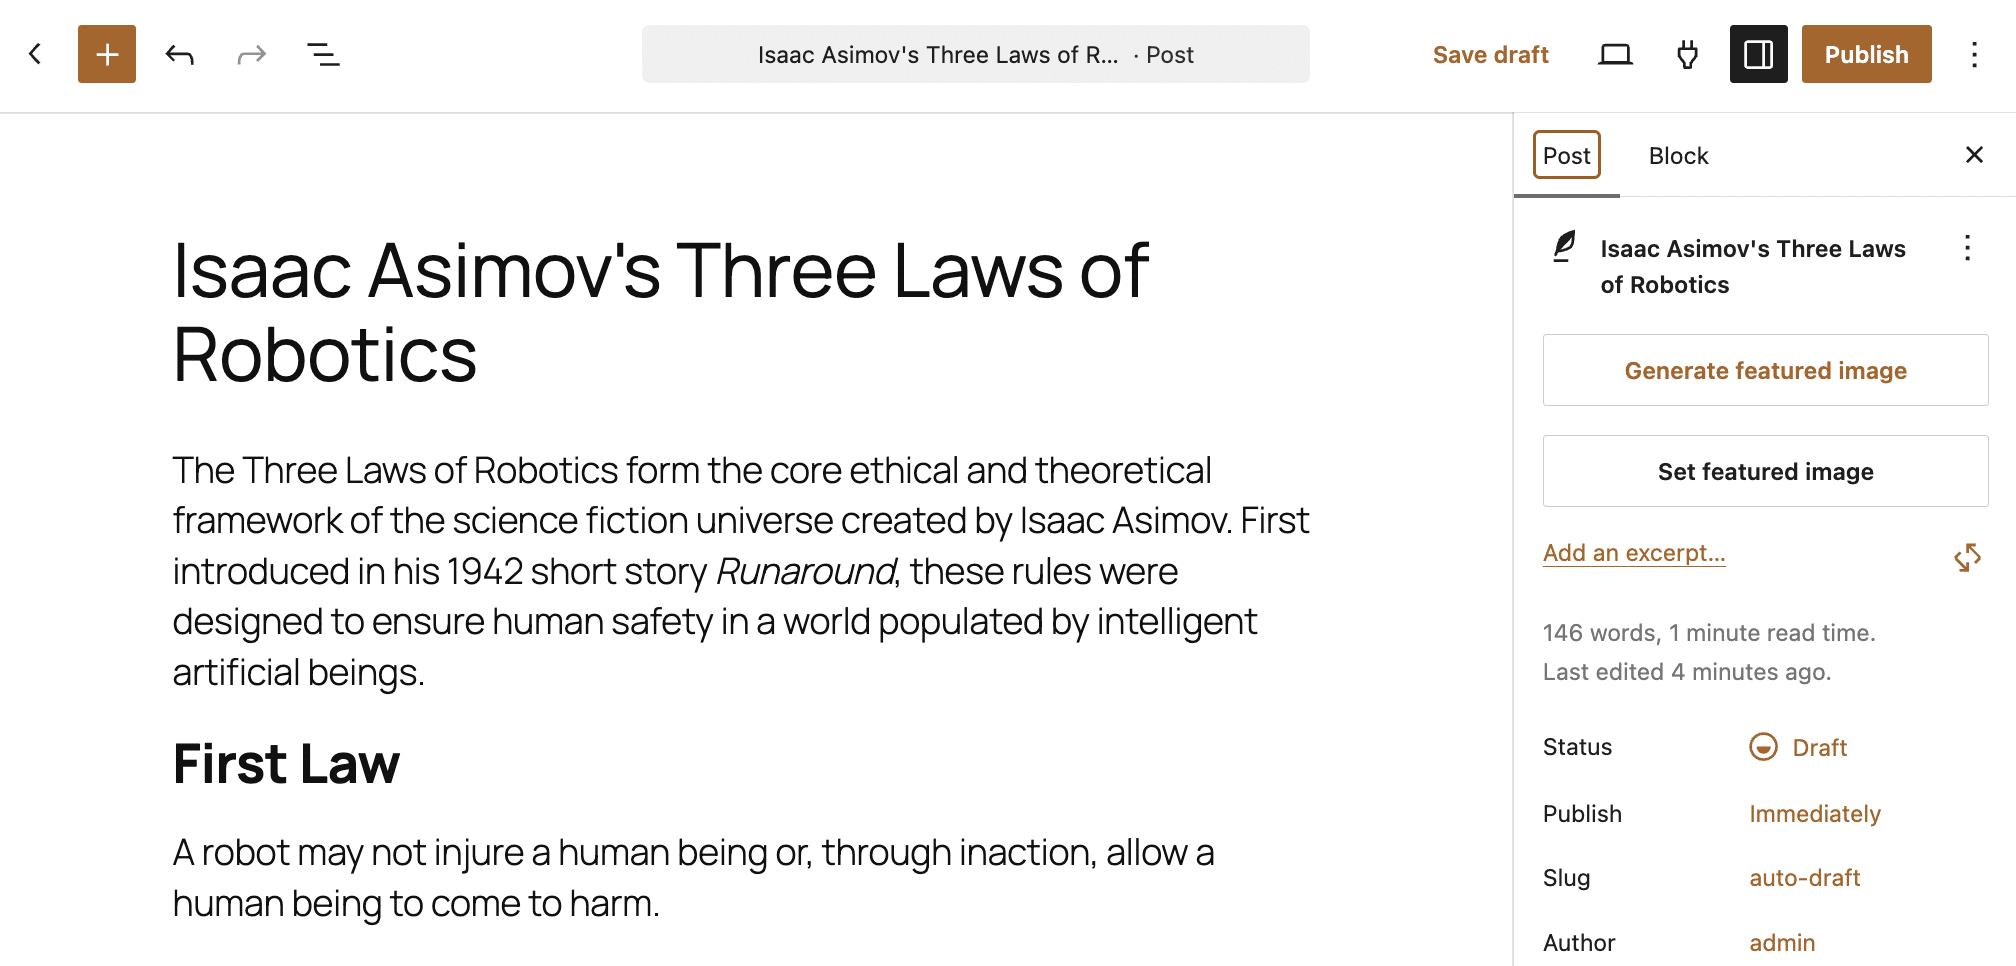
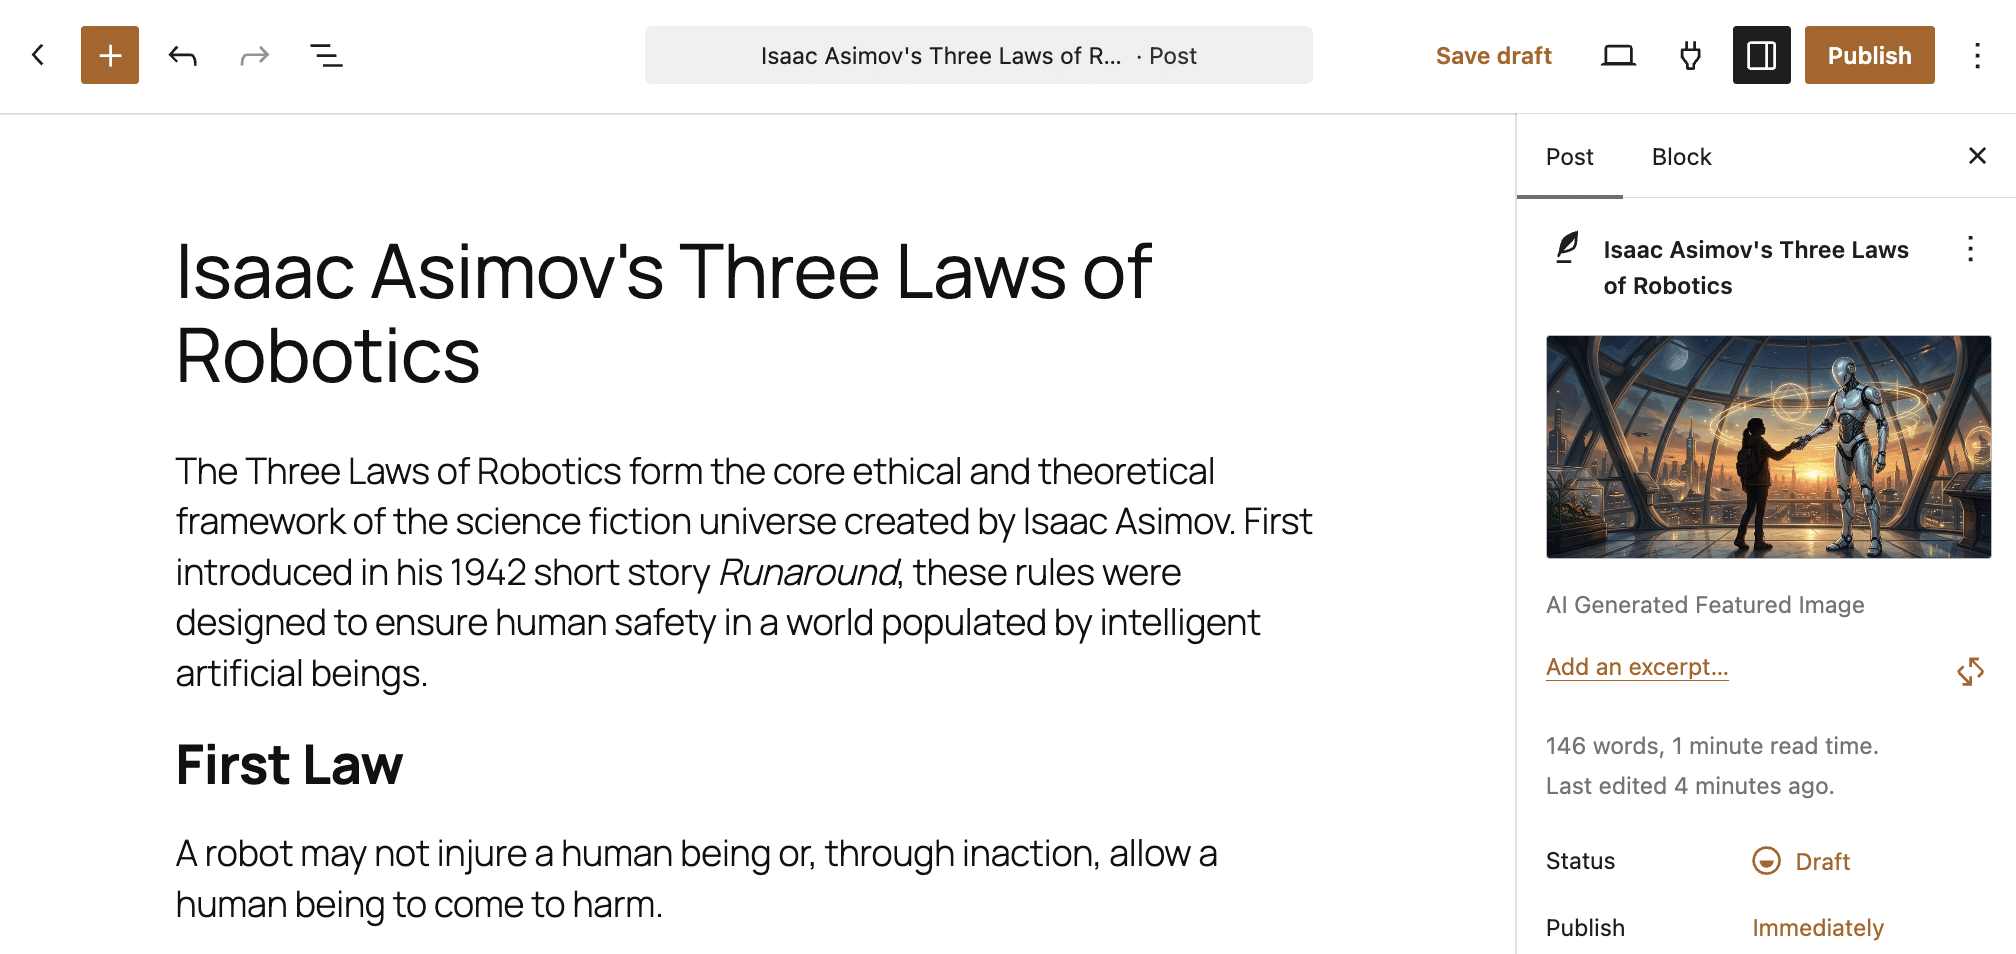
To understand the real-world impact of executing commands through the WordPress Abilities API, analysts can examine a typical workflow such as requesting an AI model to generate a featured image for a blog post. While the precise execution time varies depending on the third-party provider’s API processing speed and the specific internal routines executed by a plugin, examining both server-side transactions and client-side browser metrics establishes a clear performance framework.
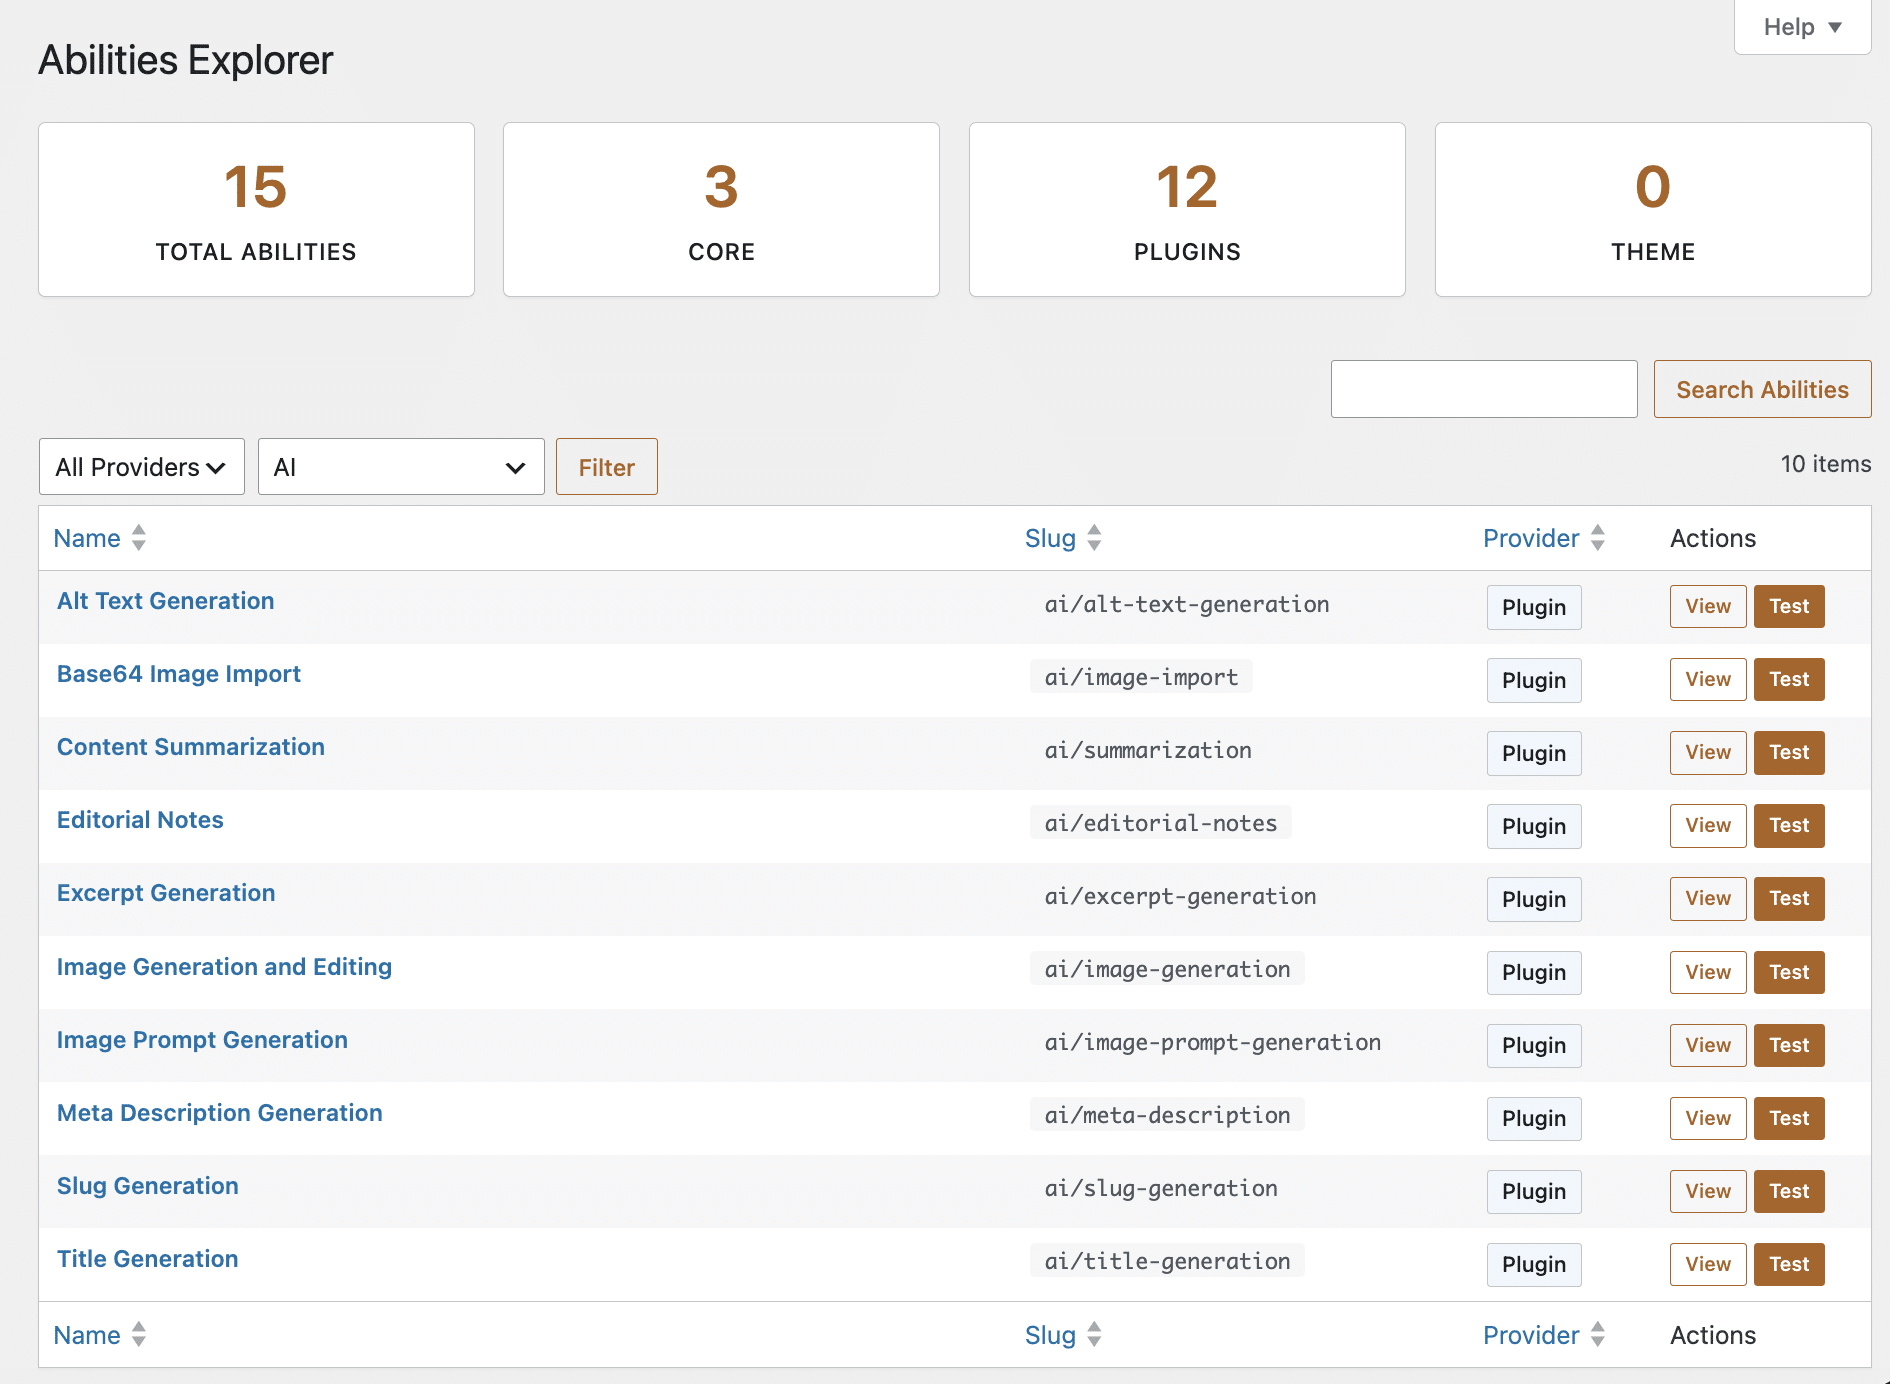
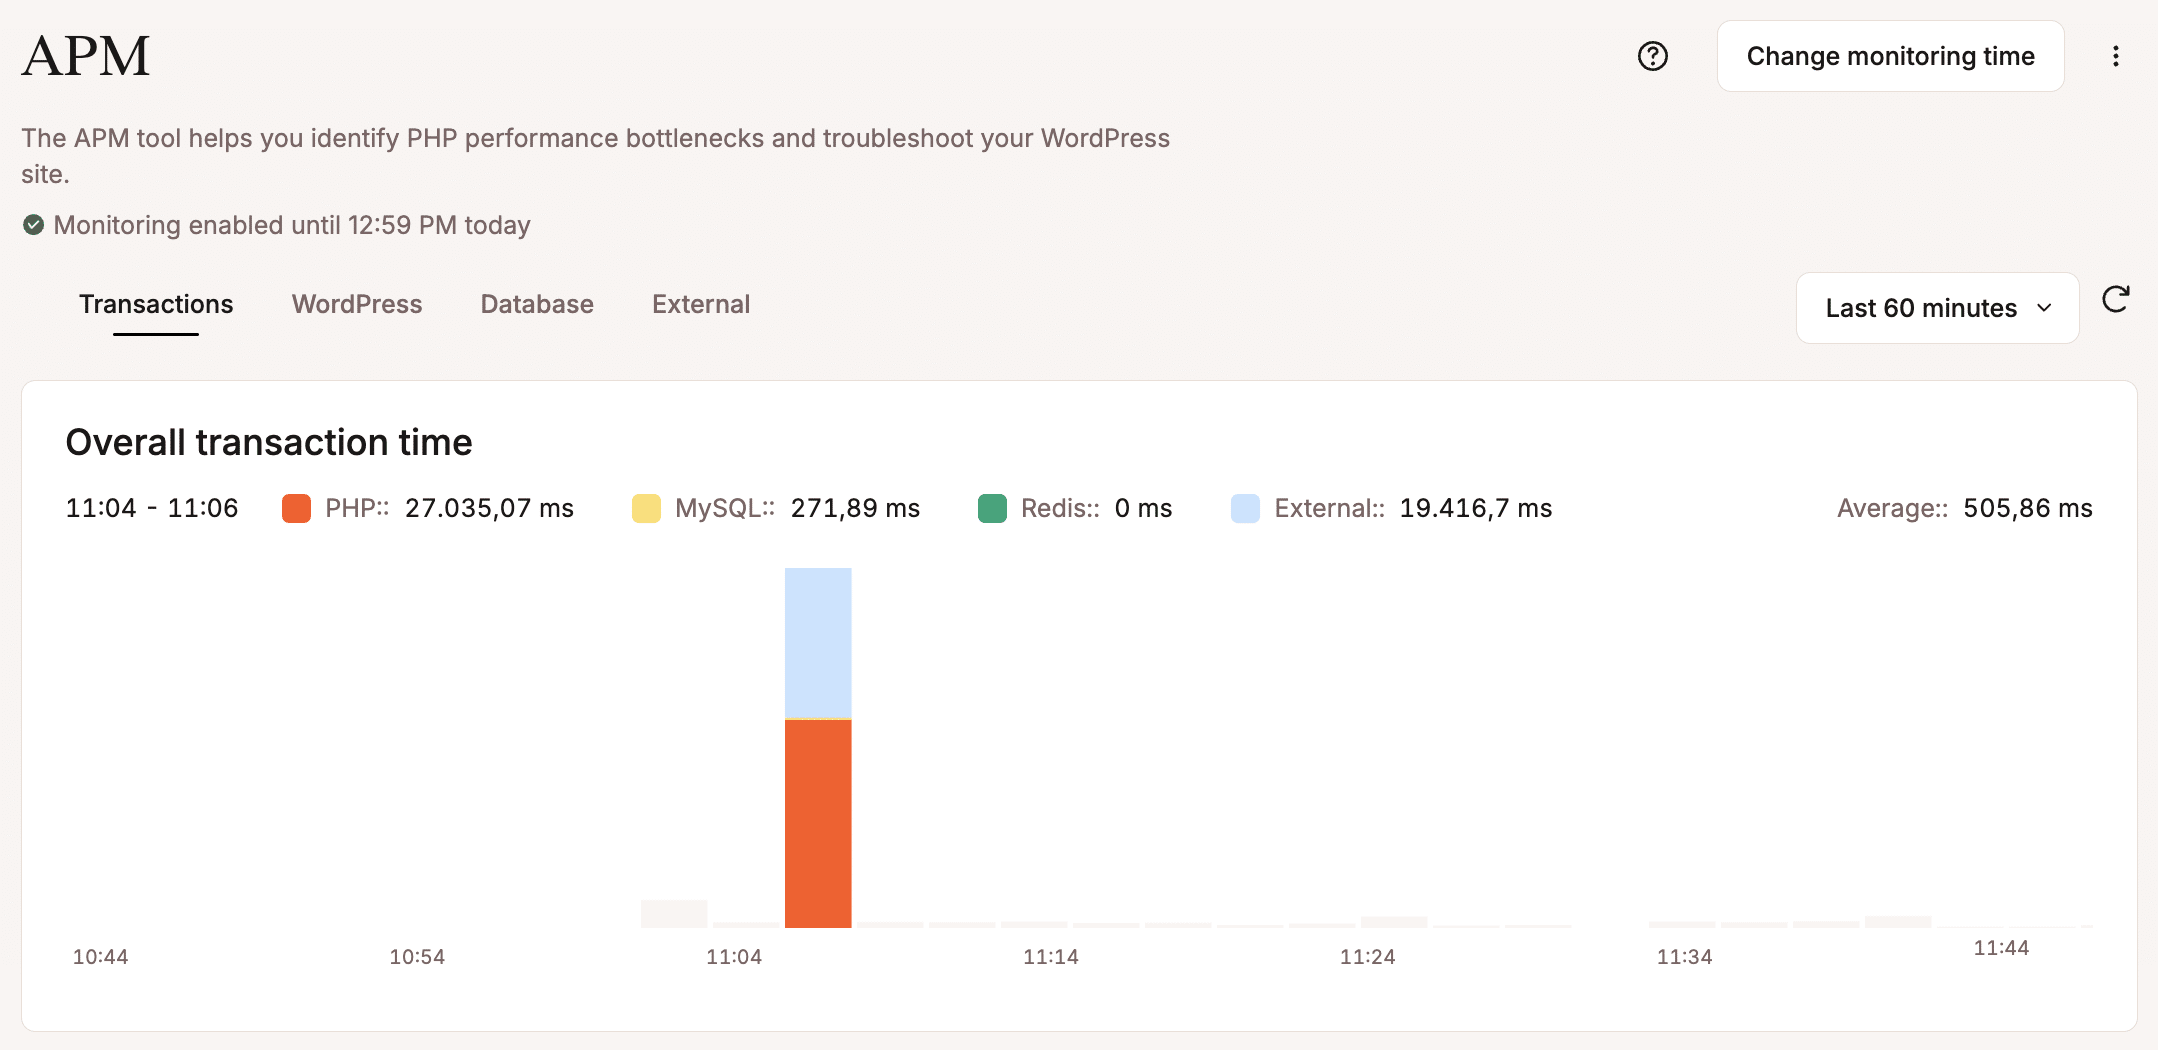
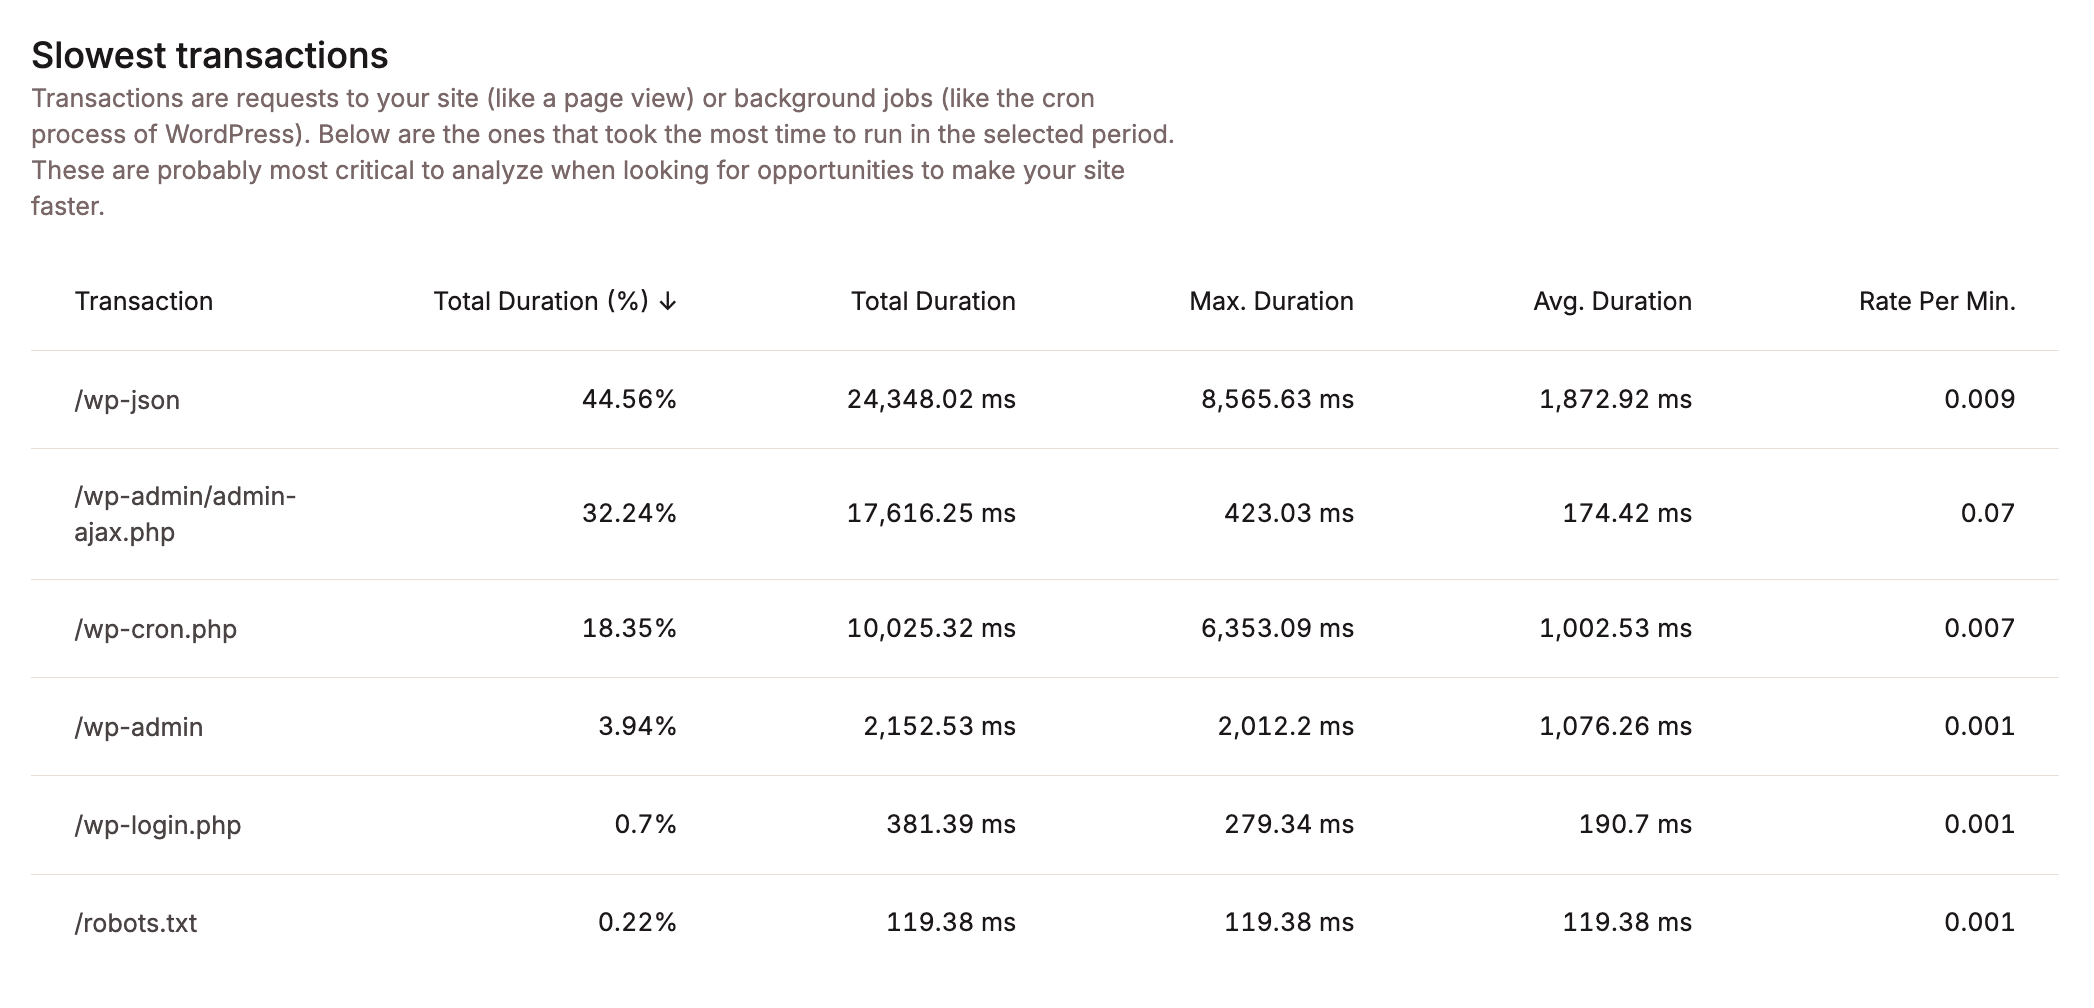
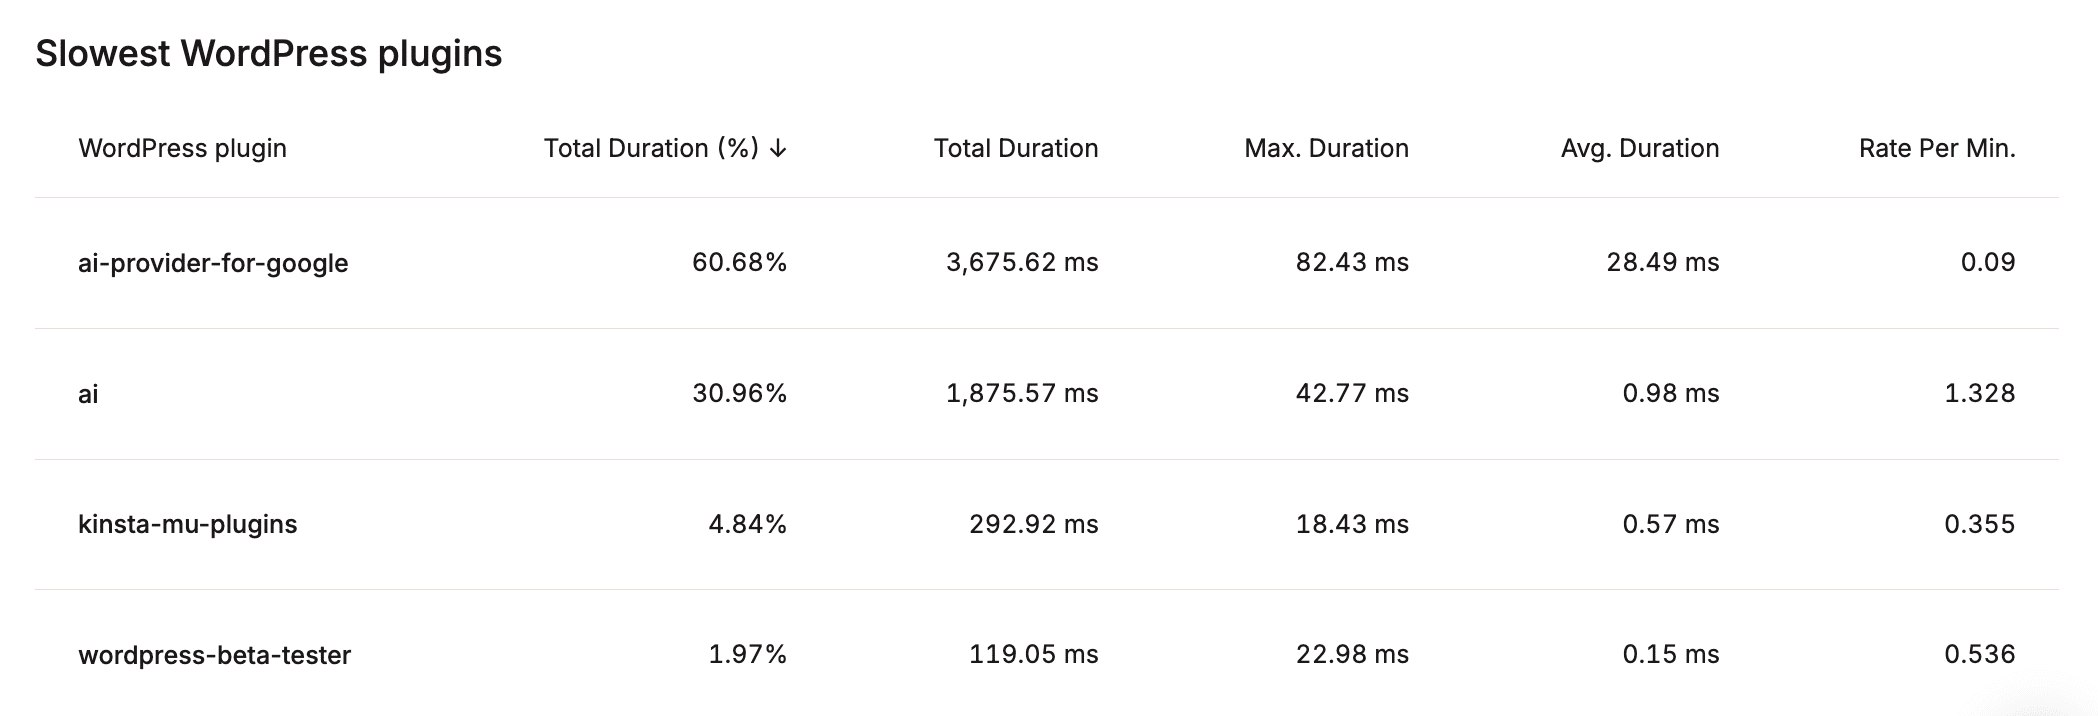
Server-side analysis using APM software reveals how backend activities handle incoming requests. Overall transaction times during active windows show that PHP execution, database queries, and external requests accumulate significant wait times when artificial intelligence endpoints are invoked. Requests targeting the standard REST API endpoints consistently account for the bulk of transaction duration. Performance breakdowns frequently show that AI-specific plugins drive the vast majority of execution time during active generation tasks, while external calls to remote AI endpoints consume the remaining duration.
Detailed transaction traces and stack traces provide a granular look at the execution path. When WordPress receives an HTTP request, it boots the core system and dispatches the instruction through the REST API controller to handle incoming tasks synchronously. The specific ability invokes the designated namespace to process the prompt, routing execution through the AI Client module. After the prompt builder translates instructions into a compatible format for external APIs, the system hands execution off to the WordPress HTTP API transport layer.
At this point, the underlying transport layer opens a synchronous connection that holds the active PHP worker until the remote provider returns a complete response. This confirms that advanced tasks like AI image generation function as synchronous, blocking operations. Because the PHP thread handling the request remains occupied for extended periods, concurrent AI operations risk exhausting the available PHP memory pool, increasing latency, and raising the likelihood of server timeouts and queuing issues.
Server Log Insights and Client-Side Network Analysis
Examining web server access logs provides an unfiltered view of HTTP requests, documenting originating IP addresses, user agents, requested endpoints, HTTP status codes, and total execution times. For a single image generation task, WordPress often executes multiple sequential calls to the underlying APIs behind the scenes. These individual steps include generating the prompt based on post content, executing the actual image creation, generating descriptive alternative text for accessibility, and finally importing the asset into the local media library.
When the cumulative execution times for these sequential requests are combined, the total PHP thread processing time becomes substantial. On traditional hosting setups with tightly constrained resources, running multiple AI-based tasks simultaneously quickly leads to PHP thread saturation, causing the server to stop responding to human visitors for several seconds. Analytics dashboards frequently track how often a site hits its allocated PHP thread limit, underscoring the vital need for robust hosting infrastructure.
Analyzing network activity from the client side using browser developer tools corroborates these server-side findings. Inspecting network panels during the image creation process highlights slow requests directed at the application programming interfaces. Reviewing the payloads and responses for prompt creation, image rendering, alternative text generation, and file downloading demonstrates that each step introduces noticeable wait times. When summed together, the cumulative client-side wait time illustrates the heavy operational load placed on both the local server and remote providers during a single content creation workflow.
Ultimately, whether site administrators rely on third-party plugins or custom code to incorporate artificial intelligence features, understanding the direct impact on server performance and resource consumption remains essential. Inefficient resource management and unoptimized code architecture can quickly overwhelm a web server, resulting in resource saturation, elevated error rates, and potential downtime. While high-performance cloud hosting environments utilize containerized infrastructure, multi-level caching, automatic database optimization, and scalable PHP workers to buffer against performance spikes, proper observability through APM and log analysis ensures modern websites remain fast, secure, and fully operational.