
Email marketing platform AWeber has rolled out a comprehensive set of visual analytics features designed to give creators and small business owners immediate clarity on their campaign performance. Announced by Sean Tinney on August 6, 2026, the update introduces interactive charts, timelines, and granular filtering tools directly into the main dashboard, eliminating the need for tedious manual data sorting and deep dives into raw spreadsheets.
The core of the update centers on transforming how open rates, click rates, and overall email comparisons are presented to users. Instead of requiring marketers to piece together the performance of individual broadcasts across different reports, the new interface synthesizes critical metrics into at-a-glance visual displays. Patterns, trends, and performance outliers now surface instantly, allowing senders to quickly identify which campaigns successfully drove audience action and which ones fell short, thereby streamlining the process of deciding what content to repeat or refine.
See engagement trends over time
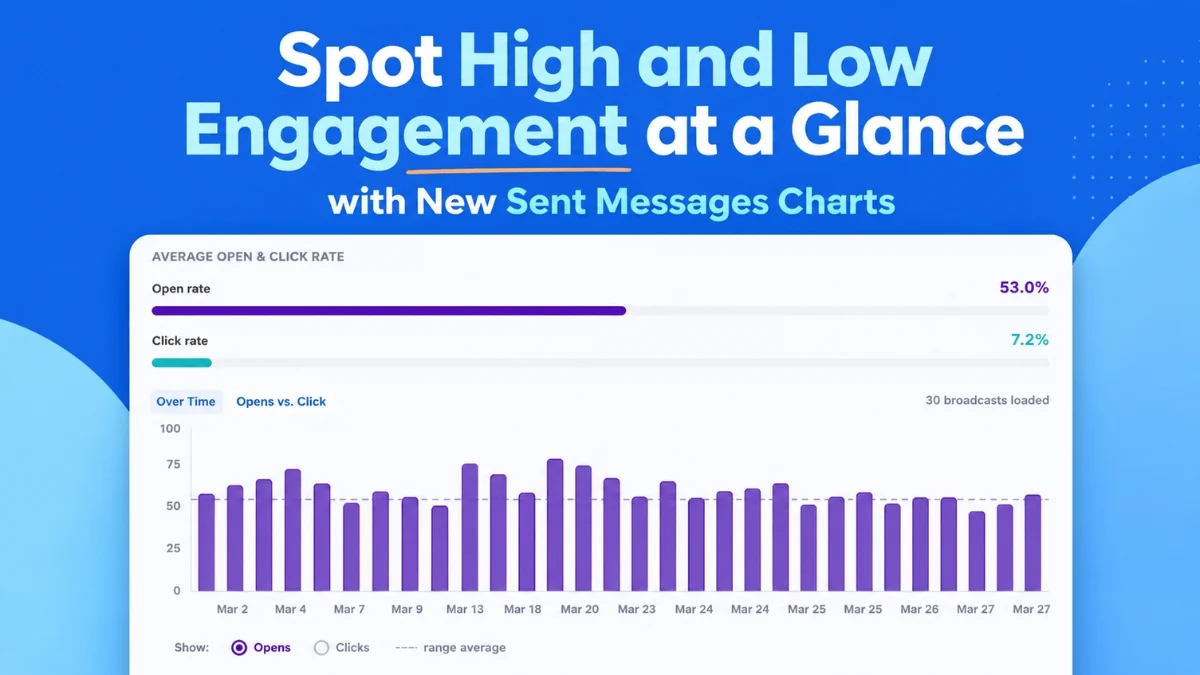
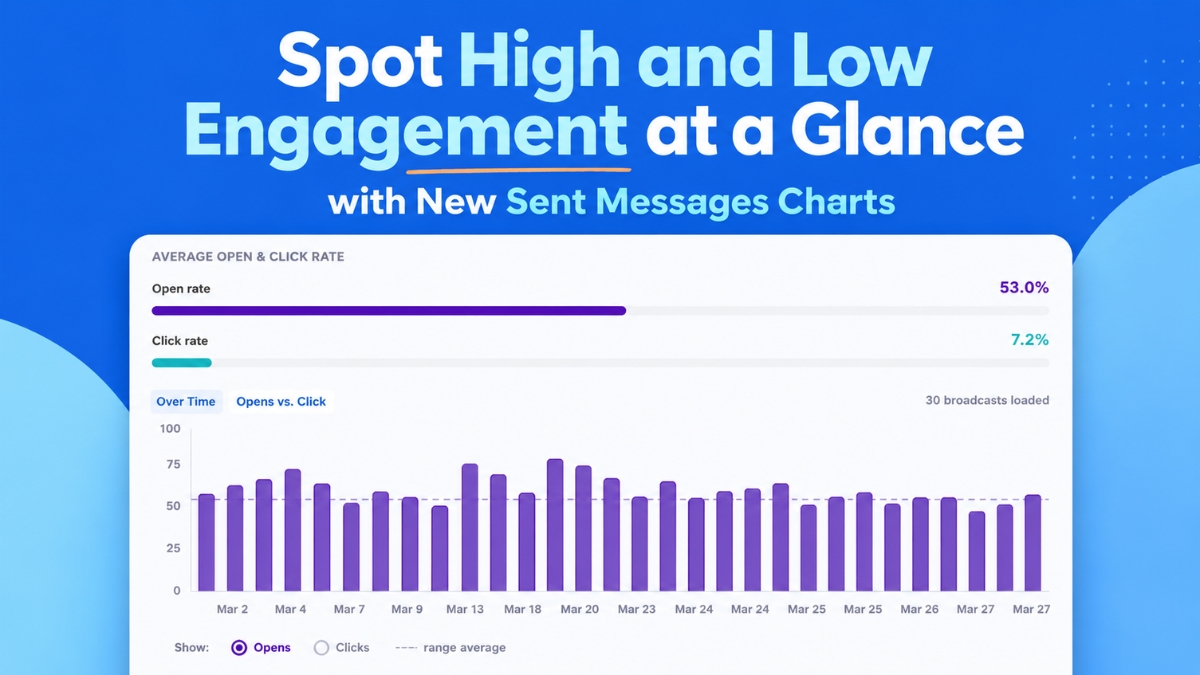
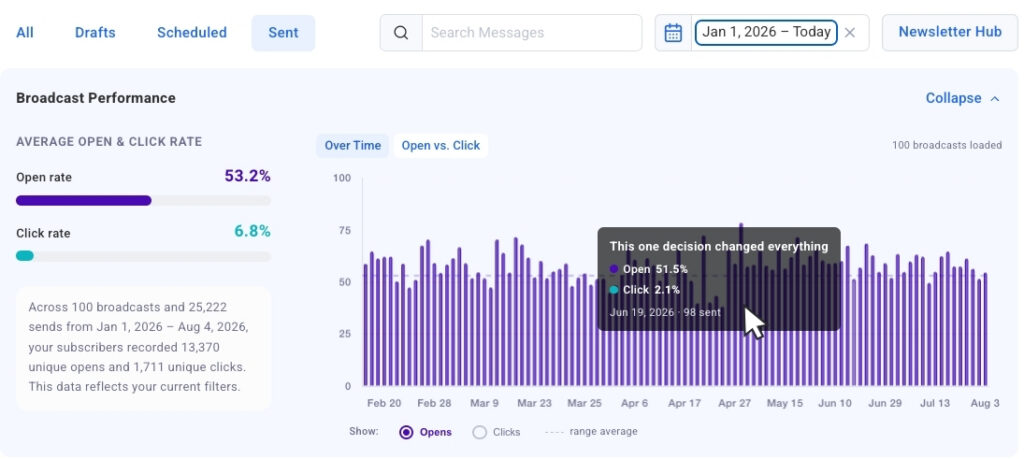
At the heart of the newly deployed interface is the Opens and Clicks Over Time chart, a visual timeline capable of plotting up to 100 of a user’s most recent broadcasts. By utilizing a simple toggle mechanism, marketers can seamlessly switch between open and click metrics to evaluate and compare performance trends across multiple sends. This chronological view is engineered to highlight recurring behavioral patterns, such as identifying a specific subject line formula that consistently commands high open rates or discovering a particular day of the week that naturally yields superior overall audience engagement.
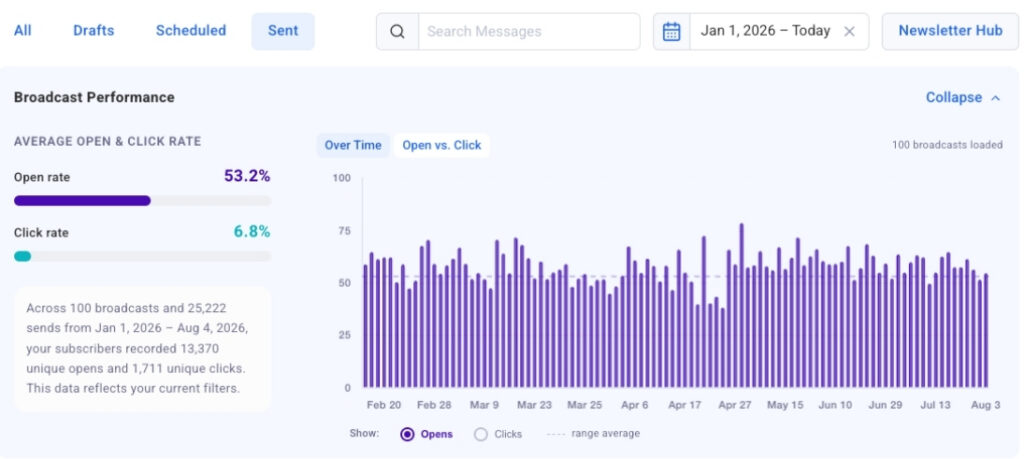
To bridge the gap between macro-level trends and granular data, the feature incorporates click-to-jump functionality. Users can click directly on any individual bar within the chart to instantly navigate to that specific broadcast located within the data table below. This reduces the time it takes to move from identifying a sudden performance spike on the visual timeline to examining the exact message responsible for it down to a matter of seconds. Furthermore, the chart is designed for fluid usability, loading automatically upon opening the dashboard and continuously populating with additional historical broadcasts as the user scrolls through their sending history.
See your strongest and weakest sends side by side
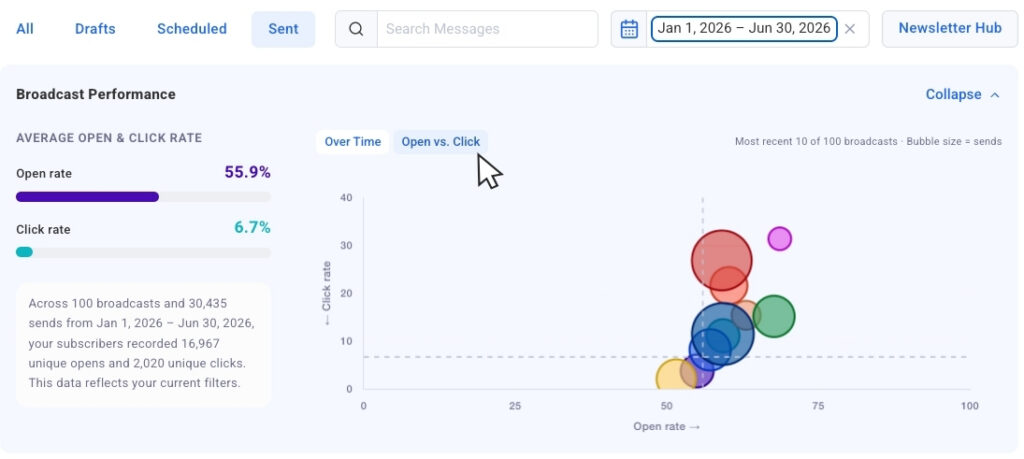
Complementing the chronological timeline is the Opens vs. Clicks bubble chart, which provides a comparative layout of a creator’s most recent broadcast history. In this view, each individual campaign is represented as an independent bubble, with its physical size dynamically scaled to reflect the total send volume. This design choice enables marketers to accurately cross-compare results across varying audience sizes without losing crucial contextual data regarding list growth or segmented reach.
This comparative matrix allows performance outliers to emerge rapidly. Senders can easily distinguish between broadcasts that captured high initial interest through compelling subject lines but generated fewer downstream clicks, and campaigns that successfully sustained engagement all the way to the call-to-action. Understanding this distribution helps administrators fine-tune their content strategy with greater precision. For moments when users prefer to analyze pure numerical metrics without visual distractions, AWeber has included a collapsible chart view, allowing the graphical interface to be tucked away or expanded on demand depending on the immediate analytical workflow.
Filter down to exactly what you want to measure
To ensure that marketers can tailor their analytical view to specific strategic goals, the platform has introduced robust filtering capabilities. Built-in date presets enable administrators to isolate performance data for the past 30 days, 90 days, or a full calendar year with a single click, prompting the visual charts to update immediately to reflect only the selected window.
Beyond chronological filtering, dynamic search tools allow users to type specific keywords directly into a search bar. The interface then automatically narrows the dataset to display only broadcasts containing those specific terms within the subject line, facilitating targeted performance comparisons of recurring campaigns or themed content series. AWeber has also confirmed that segment name filtering will soon be added to the platform, empowering users to isolate chart and table metrics by specific audience segments—an essential capability given that engagement rates naturally vary across different subscriber groups.
These dashboard enhancements build upon broadcast analytics features previously made available through the AWeber MCP app for ChatGPT and Claude.ai, bringing that same level of sophisticated data visualization directly into the core web interface. The updated Sent Messages charts are now fully live and accessible to all users within their AWeber accounts, continuing the platform’s ongoing effort to provide actionable, easy-to-interpret marketing insights for small businesses and digital creators.