
By Sean Tinney
Email marketers and small business owners navigating the complexities of digital communication often face a common hurdle: the time-consuming process of digging through dense rows of data to understand what resonates with an audience. Recognizing this challenge, email marketing platform AWeber has rolled out a comprehensive suite of visual analytics tools designed to bring clarity, speed, and intuitive design to performance tracking. Announced by Sean Tinney, the update introduces interactive charts, dynamic filtering capabilities, and side-by-side comparisons directly into the user’s dashboard, eliminating the friction traditionally associated with reviewing broadcast metrics.
At the core of the new release is a redesign of how open rates, click rates, and overall engagement comparisons are displayed. Rather than forcing users to export spreadsheets or cross-reference disparate reports, the updated interface presents vital metrics in a clean, visual format available at a glance. By turning raw numbers into interactive graphical timelines and comparative bubble charts, the platform aims to help creators quickly identify which messages successfully drove action and which fell flat, allowing them to iterate and send more of what works with minimal effort.
See Engagement Trends Over Time
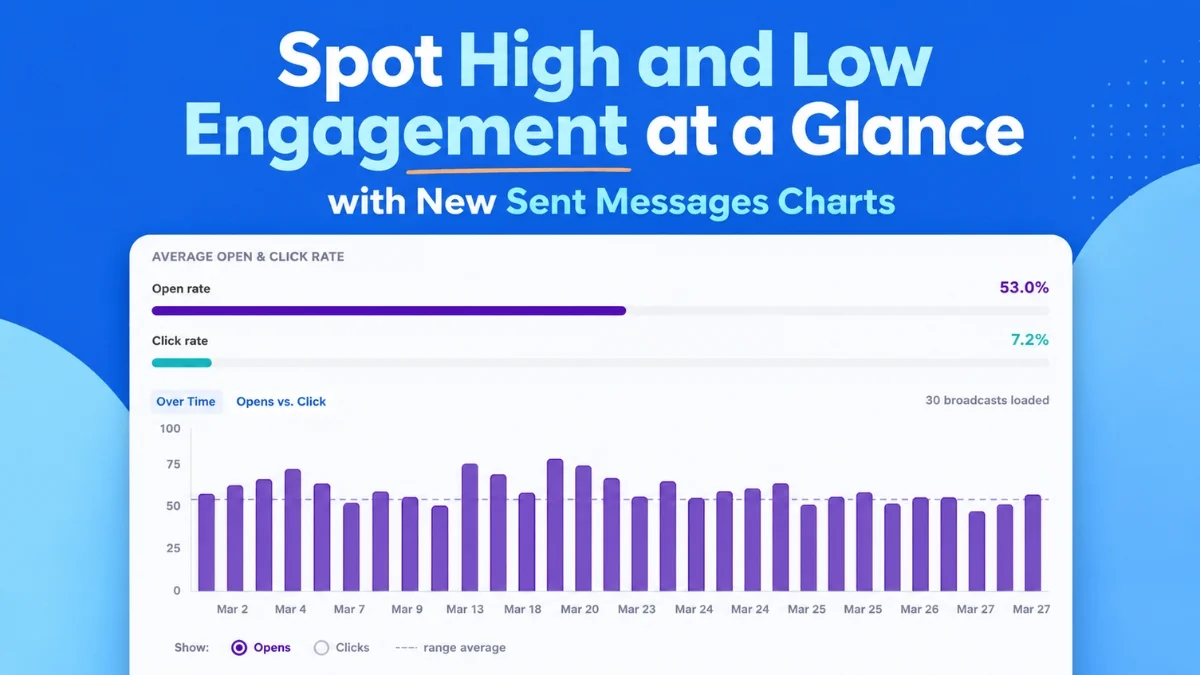
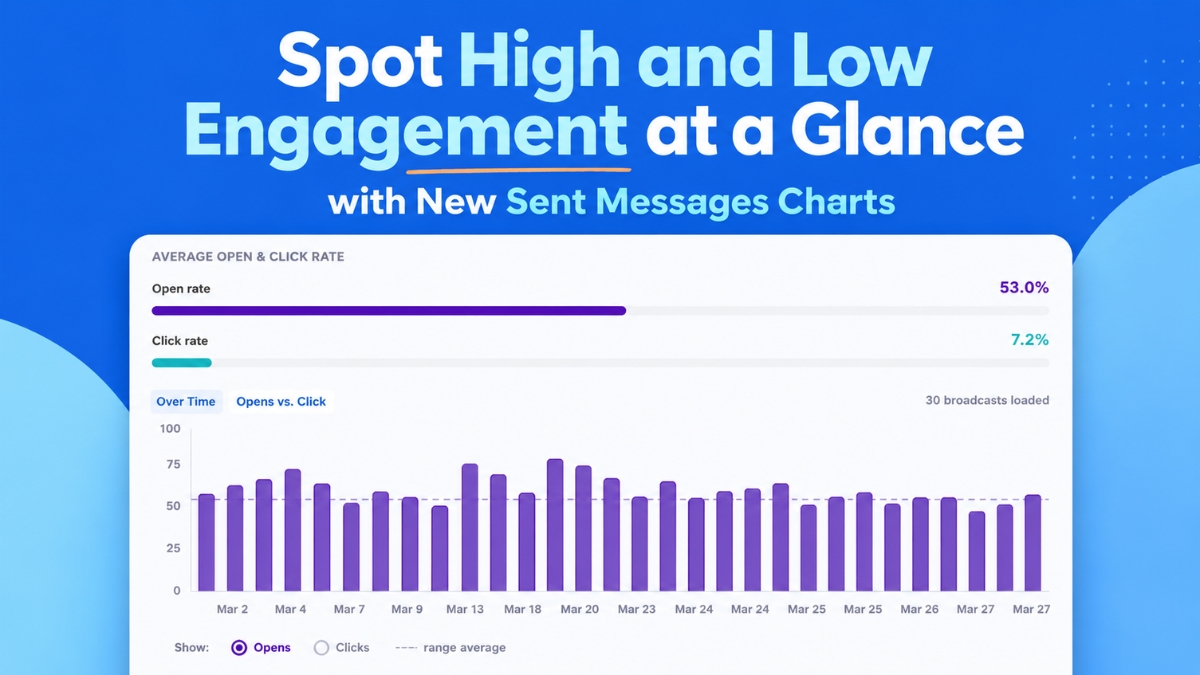
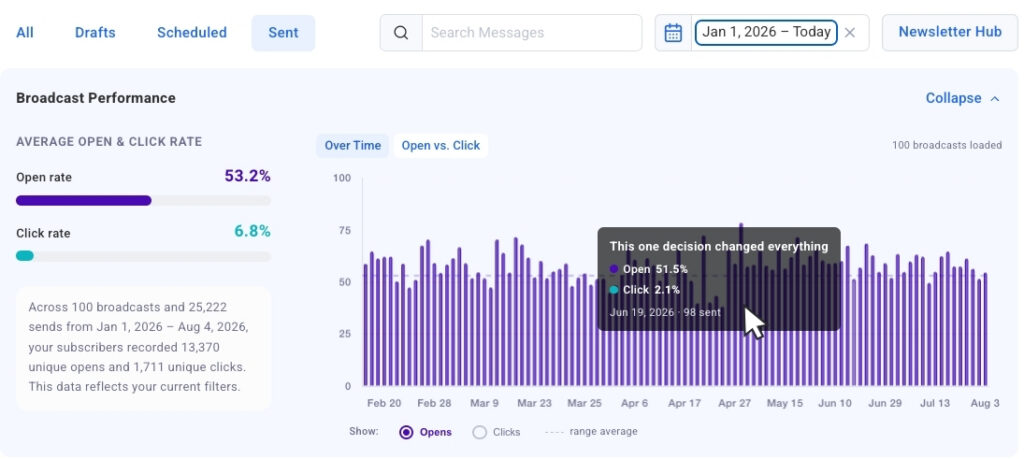
One of the most notable additions to the platform is the Opens and Clicks Over Time chart. This feature plots up to 100 of a user’s most recent broadcasts onto a single, cohesive visual timeline. Designed to surface behavioral patterns and performance outliers instantly, the timeline features a simple toggle that allows marketers to seamlessly switch between opens and clicks to evaluate how different campaigns stack up against one another.
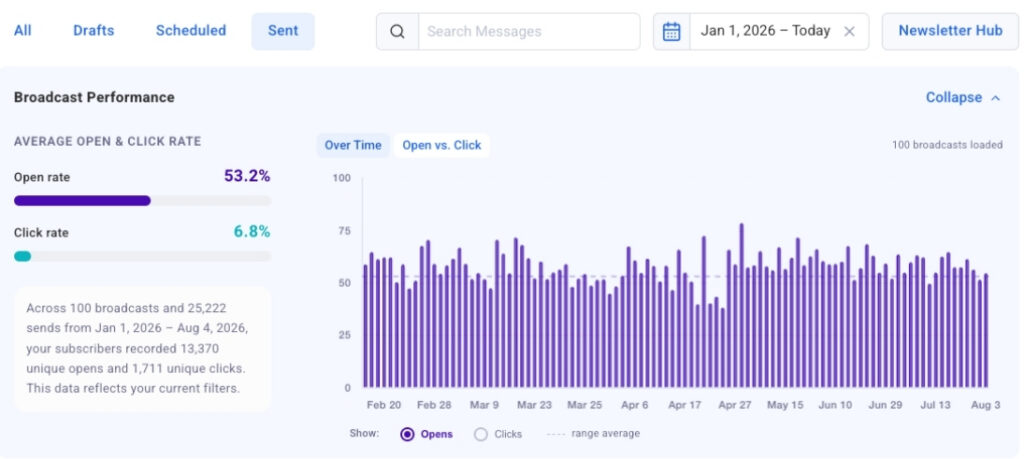
Through this historical view, subtle trends that might otherwise get lost in a traditional data table become immediately apparent. A subject line that consistently commands high open rates or a specific send day that commands superior audience engagement can be spotted almost instantaneously. Furthermore, the development team integrated a click-to-jump mechanism that bridges the gap between high-level visualization and granular inspection. By clicking any data bar on the timeline, users are instantly linked directly to that specific broadcast in the detailed table below, shortening the journey from noticing an unexpected traffic spike to examining the exact message in a matter of seconds.
The user experience has also been engineered for seamless navigation. The chart loads automatically upon opening the dashboard, and as creators scroll through their history to load older broadcasts, the bar chart populates dynamically to maintain a continuous and uninterrupted analytical workflow.
See Your Strongest and Weakest Sends Side by Side
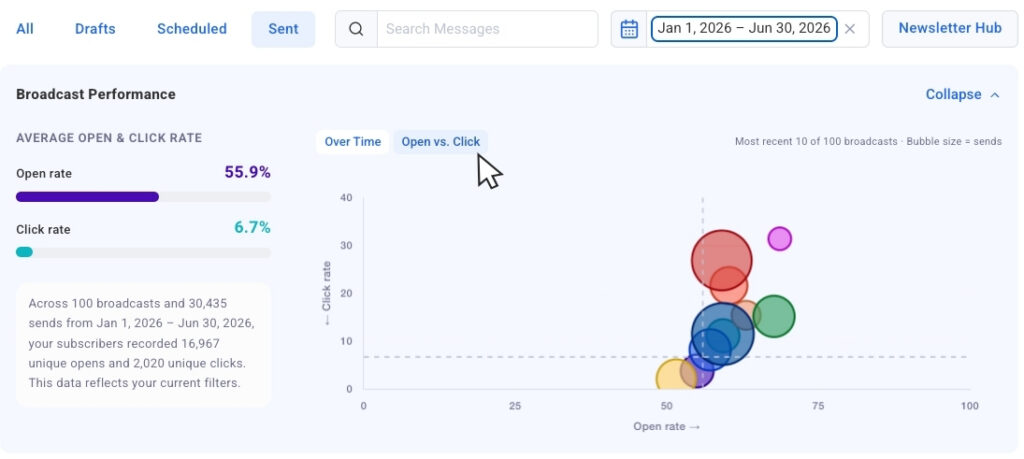
Moving beyond chronological timelines, AWeber has introduced an Opens vs. Clicks bubble chart that provides a multidimensional look at recent campaign performance. In this view, each broadcast is represented individually as a bubble. Crucially, the size of each bubble corresponds directly to the send volume of that particular message. This design choice enables marketers to compare results across varying audience sizes without losing the vital context of scale.
This visual representation is particularly effective at surfacing operational outliers. Marketers can easily distinguish between broadcasts that successfully captured attention with high open rates but failed to generate downstream momentum through clicks, and those rare campaigns that achieved strong results across both metrics. Identifying these patterns provides clear, actionable insights into what content styles, offers, or formats should be replicated, and which require strategic adjustment.
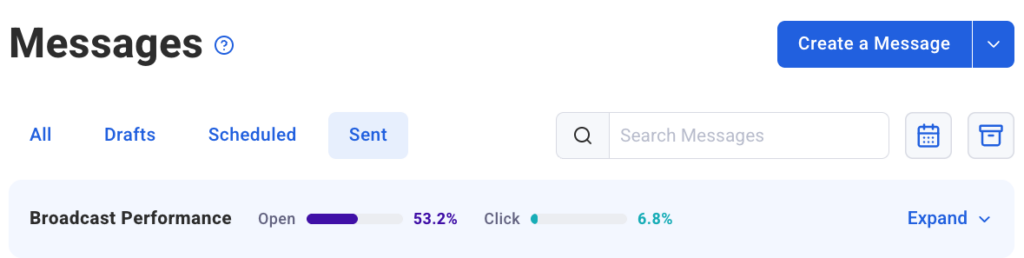
To accommodate different working styles and preferences, the platform includes a collapsible chart view. When users wish to focus purely on the raw numerical data contained within the lower table, the visual charts can be effortlessly tucked away. They can be expanded just as easily whenever the creator wants to restore the broader visual context to their analysis.
Filter Down to Exactly What You Want to Measure
To ensure that the analytics remain manageable even for high-volume senders, the updated dashboard incorporates robust filtering tools. Date presets allow users to isolate performance data from the past 30 days, the past 90 days, or a full calendar year with a single click, causing the associated charts to update immediately to reflect only the selected window.
For more granular investigations, dynamic search filtering offers an even deeper level of control. By typing keywords into the search bar, creators can instantly narrow the chart parameters to display only broadcasts containing specific terms within the subject line. This allows for precise comparative analysis of recurring campaign types, promotional series, or topical newsletters.
Looking ahead, AWeber has confirmed that segment name filtering will soon join the platform’s feature set. This upcoming capability will enable users to isolate both chart and table data by specific audience segments, acknowledging the reality that engagement levels naturally fluctuate across different subsets of a subscriber base.
These newly integrated dashboard charts build upon the broadcast analytics capabilities previously introduced in the AWeber MCP app for ChatGPT and Claude.ai, bringing that same sophisticated visual perspective directly into the core user interface. By streamlining how creators monitor open rates, track longitudinal trends, and evaluate audience engagement, the platform continues to refine the tools available to small businesses striving to improve their digital marketing outcomes over time. The updated Sent Messages charts are live now and available to all AWeber users.